Case Studies
Industrial AI & Engineering Case Studies
Most technical projects look great on paper but fail in production. My engineering focus has always been on building systems that survive real-world industrial environments. Below are key case studies demonstrating how I bridge the gap between software development, hardware engineering, and machine learning to solve expensive industrial problems.
1. DotPulse: Autonomous Optical Granulometry (LogicYield)
The Industrial Problem: Standard laboratory sieve analysis for fertilizer granules happens only once every 4 hours. This creates a massive blind spot, leading to long delays in adjusting technological processes. Plants lose significant raw materials and energy while producing non-conforming products until the target regime is reached.
The Solution: I architected DotPulse, an Edge AI optical agent that performs real-time granulometry (size, color, and sphericity analysis) directly on the active conveyor belt. Using heavily optimized instance segmentation (UNet/MobileNetV3), it successfully maps physical boundaries of highly variable, overlapping granules without requiring modifications to the workshop design.
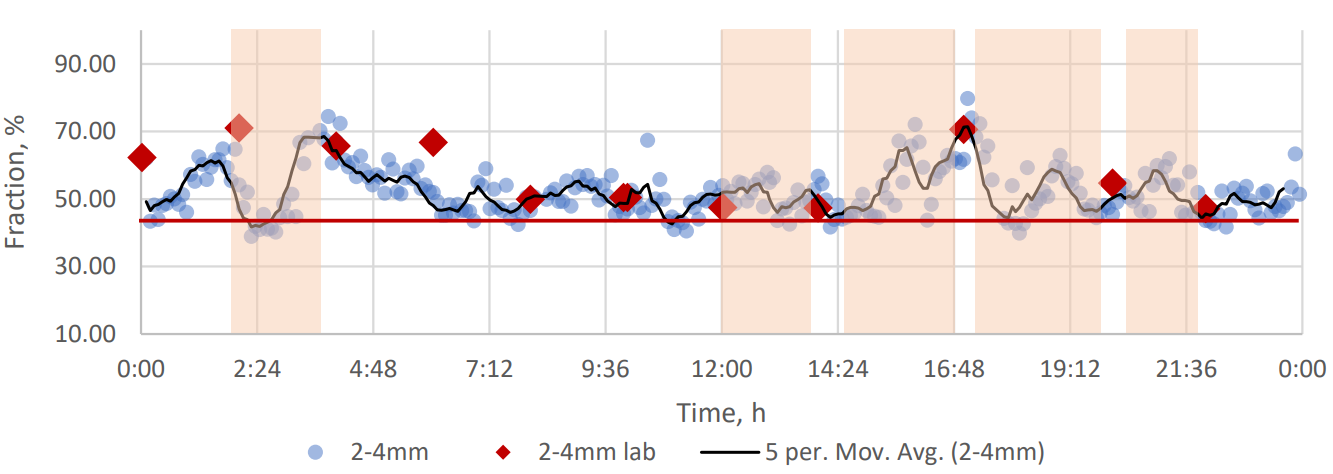
An example of an unstable process, deviations detected by the “DotPulse” but missed by the laboratory are highlighted with red rectangles, blue dots are “DotPulse” measurements every 5 minutes, the black line is a smoothing average, red dots are laboratory data, the red line at 45% shows the possible limit of the technological process (below which the product is considered as waste)
The Impact: Decreased factory reaction speed from 4 hours down to just 5 minutes, eliminating an estimated $1.8M in annual defect losses per plant. The system operates autonomously in extreme dust and vibration conditions while maintaining a >90% correlation with traditional laboratory tests.
2. GuardDetector: Edge AI for Occupational Safety (LogicYield)
The Industrial Problem: Fictitious "paper" rounds of machinery maintenance and ignored safety compliance (PPE) in dangerous chemical zones lead to catastrophic equipment failures and personnel risks. Plant managers lacked a reliable way to verify actual maintenance execution.
The Solution: I developed a 100% Edge AI video analytics system utilizing MobileNetV3 and BERT for temporal sequence-tagging of human actions and PPE compliance.
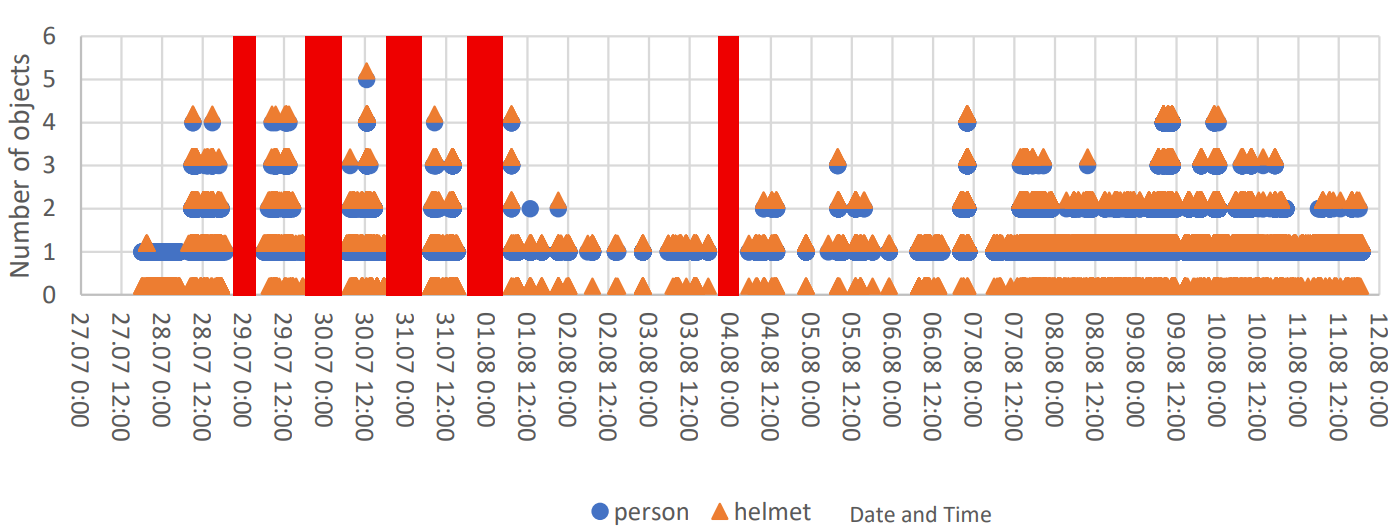
Personnel presence chart from 28.07-12.08.2025 with highlighting of “dead intervals” (red vertical lines)
The Impact: Eliminated blind spots in factory maintenance, eliminating up to $2M in annual operational bleed per facility. Because the system runs entirely on Edge CPUs rather than expensive GPU servers, it ensures a drastically lower Total Cost of Ownership (TCO) and guarantees strict information security (privacy by design).
3. Foundational Dataset for Industrial Computer Vision (LogicYield)
The Industrial Problem: Standard computer vision models fail on mineral fertilizers because granules are highly variable, dusty, and visually overlapping. Furthermore, there were no high-quality, specialized datasets available to train reliable industrial models.
The Solution: I directed the creation of a comprehensive, pixel-perfect dataset for instance segmentation of mineral fertilizer granules. This involved complex polygon markups of touching and overlapping objects to teach the neural network the strict physical boundaries of the product.
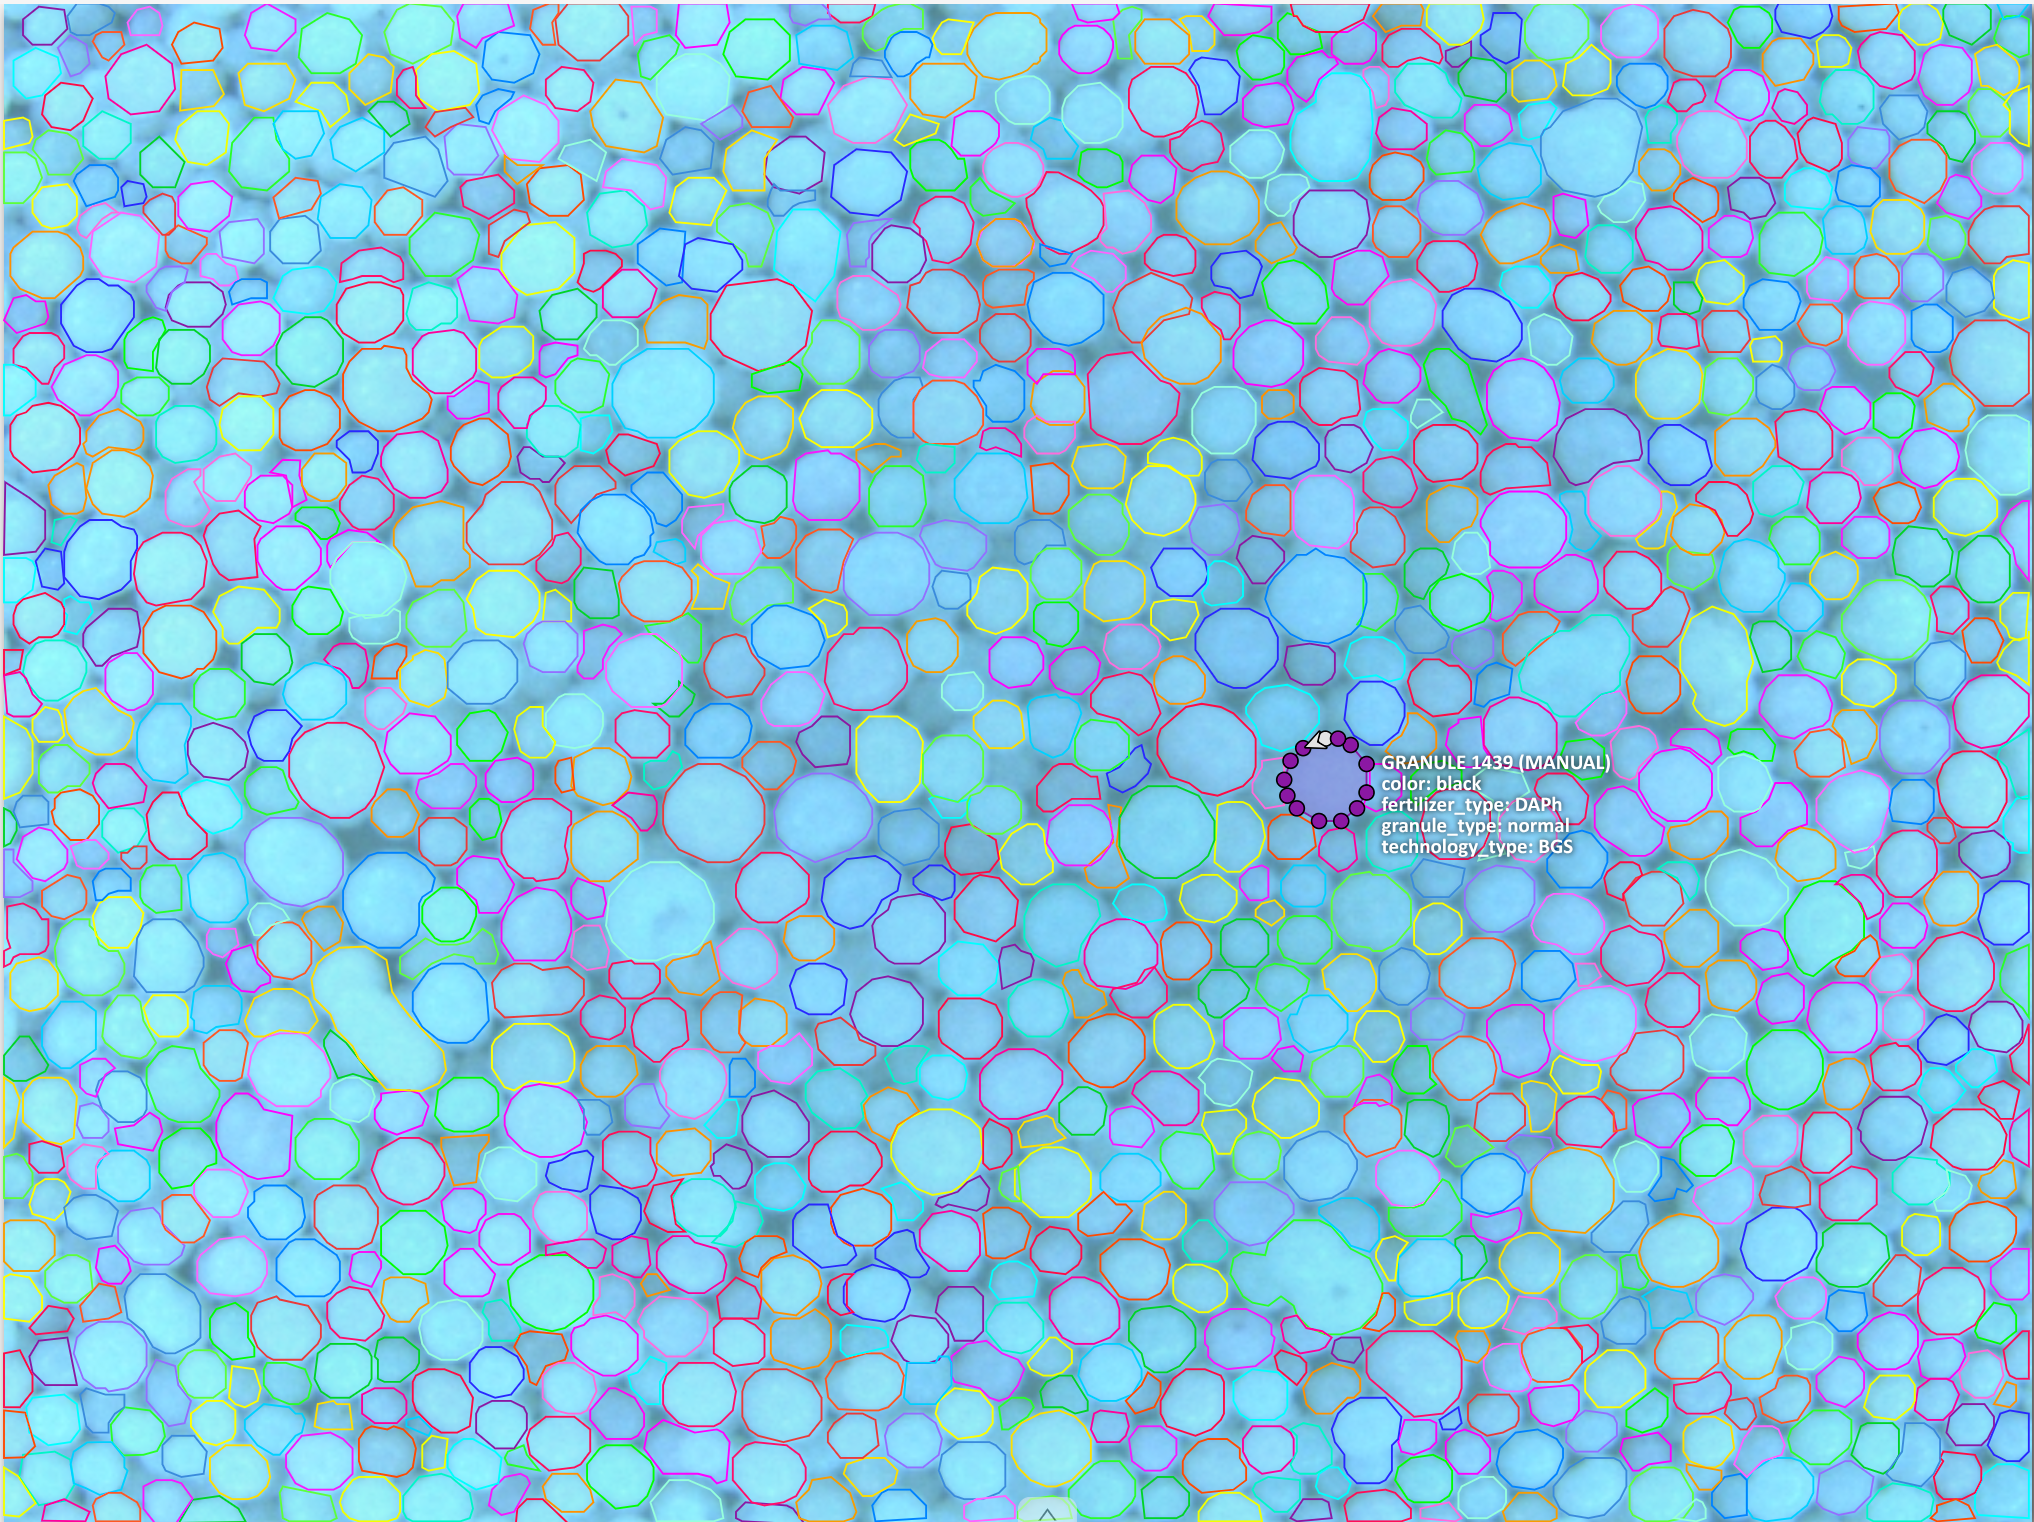
Annotation example
The Impact: This dataset became the foundational training ground for the DotPulse autonomous optical agent, making its real-time conveyor belt analysis possible.
4. Hybrid AI Quality Prediction (PhD Thesis Work)
The Industrial Problem: Traditional physical and chemical quality checks (e.g., nitrogen content, fraction size) required separate, time-consuming, and highly manual laboratory procedures.
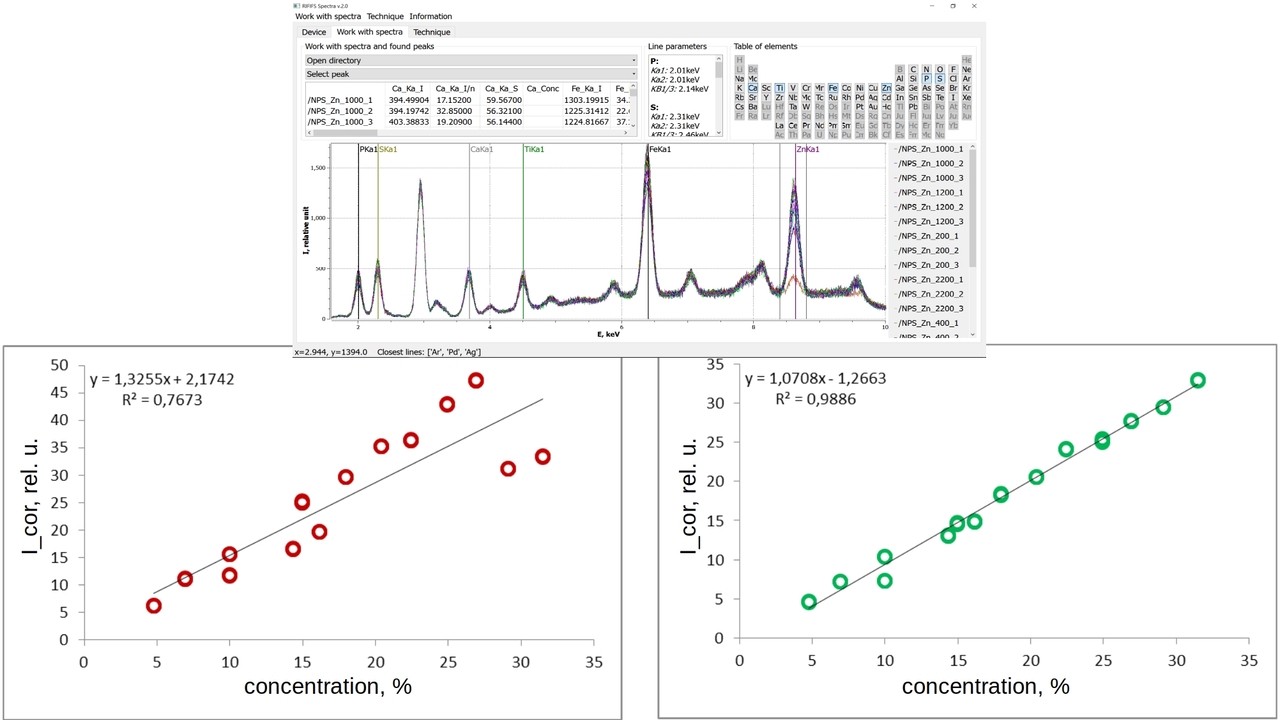
The Solution: I designed a hybrid analysis pipeline combining X-ray fluorescence (XRF) with optical computer vision. By feeding this multi-modal data into Random Forest and specialized regression models, the system could simultaneously predict over 30 different fertilizer properties.
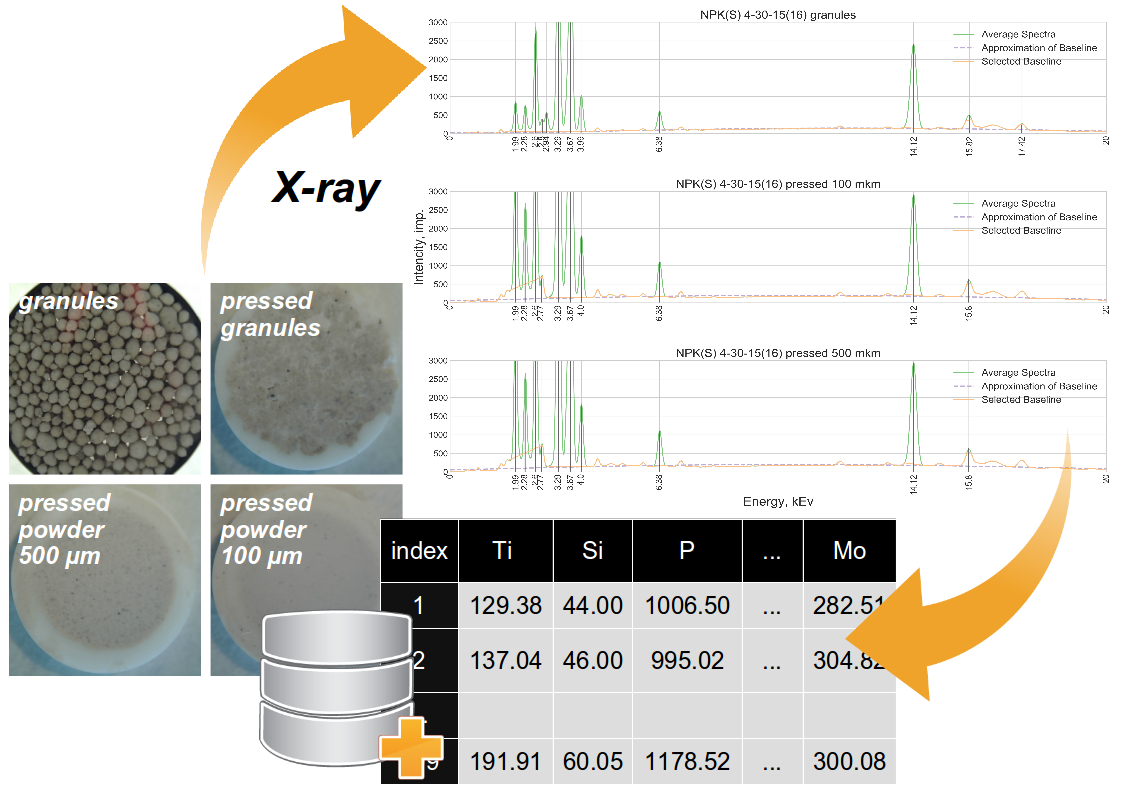
PhD Graphical Abstract
The Impact: Processed over 500 industrial samples to prove that automated AI prediction can achieve near 100% classification accuracy, drastically reducing manual lab prep. This research resulted in a patented utility model.
5. Supply Chain Security & "Fingerprint" Analysis (Fertilizer Facility)
The Industrial Problem: Rapidly identifying the manufacturer and standard compliance of mineral fertilizers is difficult, making agricultural supply chains vulnerable to counterfeit or off-spec products.
The Solution: Engineered an automated software system utilizing energy-dispersive X-ray fluorescence (ED XRF) spectra. I applied k-means clustering and statistical algorithms to map unique chemical "fingerprints" for different brands.
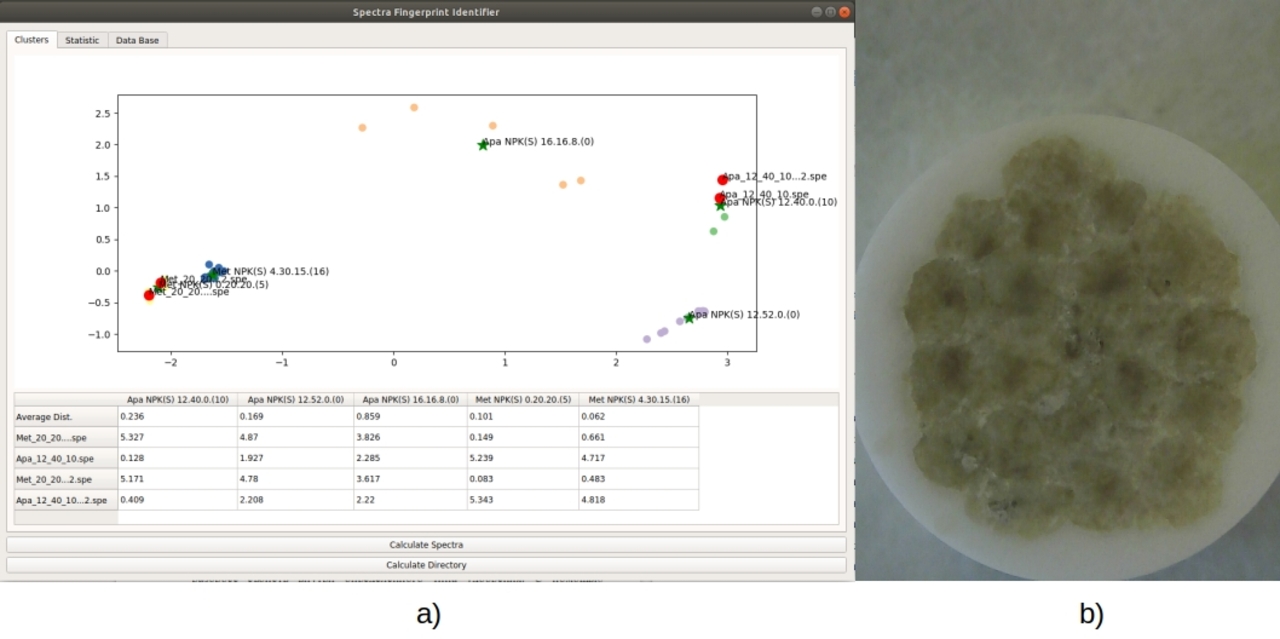
Fingerprint Analyzes Software
The Impact: Enabled instant, express identification of fertilizer origins and quality compliance without complex wet-chemistry lab work.
6. Anti-Caking Optical Analysis (Fertilizer Facility)
The Industrial Problem: Fertilizer caking during storage causes massive financial losses worldwide, but the exact microscopic mechanism of how granules bind was difficult to continuously monitor and quantify.
The Solution: Developed a custom hardware-software pipeline to monitor, record, and algorithmically analyze micro-interactions of granules (color, surface texture, reflections) over time under controlled environmental conditions.
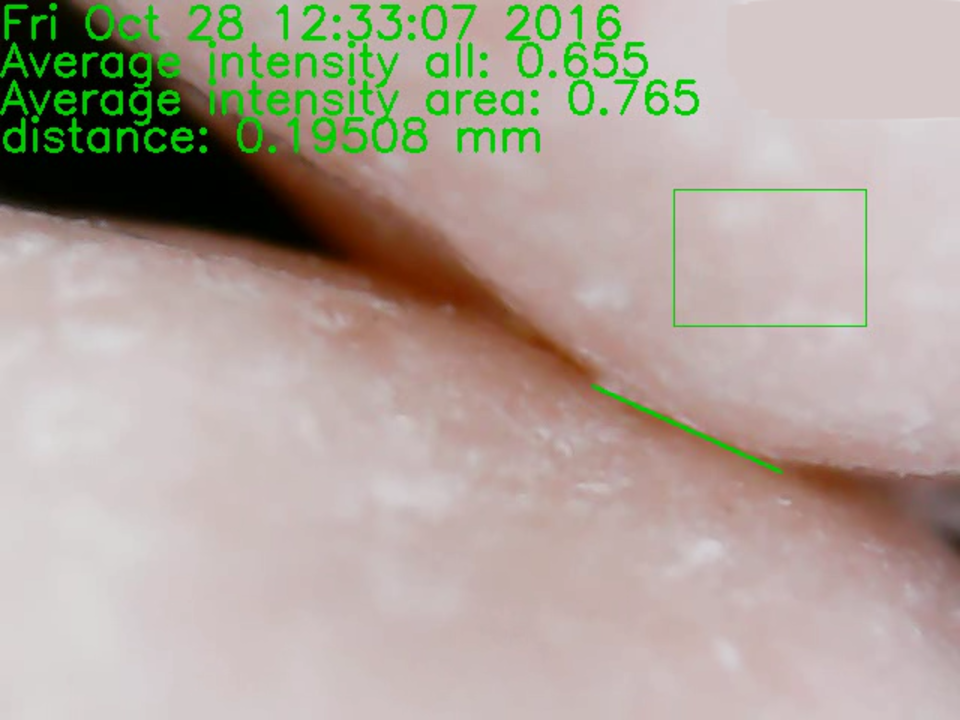
Example of Caked Granules (Software)
The Impact: Successfully isolated and visualized the "ring effect" (moisture buildup at the exact point of contact between granules). This provided crucial, actionable data to optimize the chemical anti-caking coatings used in the factory.
7. Modernizing Industrial Standards for Salt Index Calculator (Fertilizer Facility)
The Industrial Problem: The industrial standard for assessing the "salt effect" (how fertilizers absorb moisture from soil and affect crops) was based on outdated 1943 models, leading to confusion and inaccurate agronomic application.
The Solution: I challenged the traditional additive assumptions, proving that even 1% impurity compounds significantly affect osmotic pressure. I modified the parameter using modern thermodynamic data and developed the "Salt Index Calculator" desktop software.
The Impact: The software and the new measurement technique were officially adopted by Russia's leading phosphate research institute (JSC "NIUIF") and integrated into the engineering curriculum at Cherepovets State University.
8. X-Ray Fluorescence Automation Software
The Industrial Problem: Laboratory control of elemental composition required slow, manual operations and complex calculations, causing costly delays in technological process adjustments.
The Solution: I developed two new techniques for physical and chemical analysis, and engineered a complete desktop software package to control X-Ray fluorescence spectrometers directly.
X-Ray Fluorescence Automation Software
The Impact: The software automated the hardware control and statistical calculations, significantly reducing human error and speeding up the delivery of critical chemical data to process operators.
9. Industrial IoT: Smart Sensors & Telemetry
The Industrial Problem: Monitoring occupational safety and equipment health in harsh chemical plants requires sensors that can survive corrosive dust and operate without stable, wired internet connections.
The Solution: I designed and prototyped custom environmental sensors (monitoring NH3, CO2, VOCs, and PM particles) paired with wireless telemetry modules.
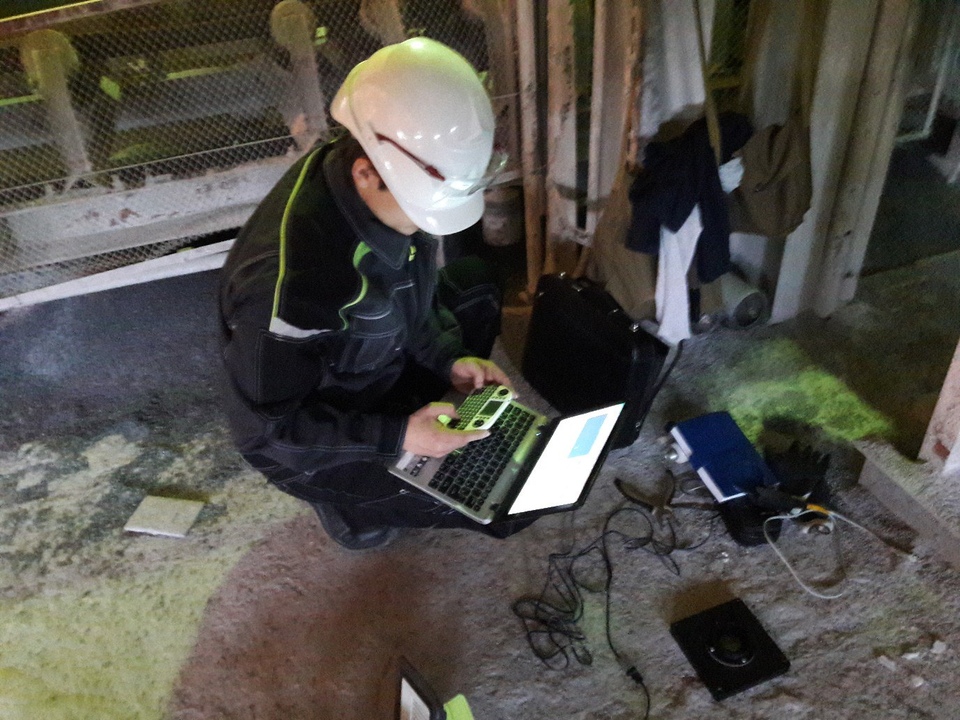
Working with Industrial IoT
The Impact: Established a reliable, decentralized data pipeline using edge microcontrollers and MQTT protocols to send real-time safety data to the factory's central dashboard without requiring massive IT infrastructure upgrades.