The DSpectra software description (X-ray fluorescence spectra processing)
Posted on 2018 / 08 / 02 in soft
This short note describes the software for solving the problem of complex processing of X-ray fluorescence spectra.
The program was developed to solve a number of problems:
- Obtaining information from X-ray fluorescence spectrometers manufactured by JSC "Scientific Instruments", with the ability to directly specify the actual measurement time, current and exposure.
- Obtaining information from any spectrometer from the *.txt file.
- Realization of various mathematical processing of spectra:
- smoothing;
- differentiation;
- selection of characteristic lines;
- calculation of the parameters of the characteristic lines and the background signal;
- Approximation of the signal by various functions.
- Save obtained information in the form of a "objects-features" matrix.
- Implementation of machine learning algorithms and work with large data sets for classification and regression techniques.
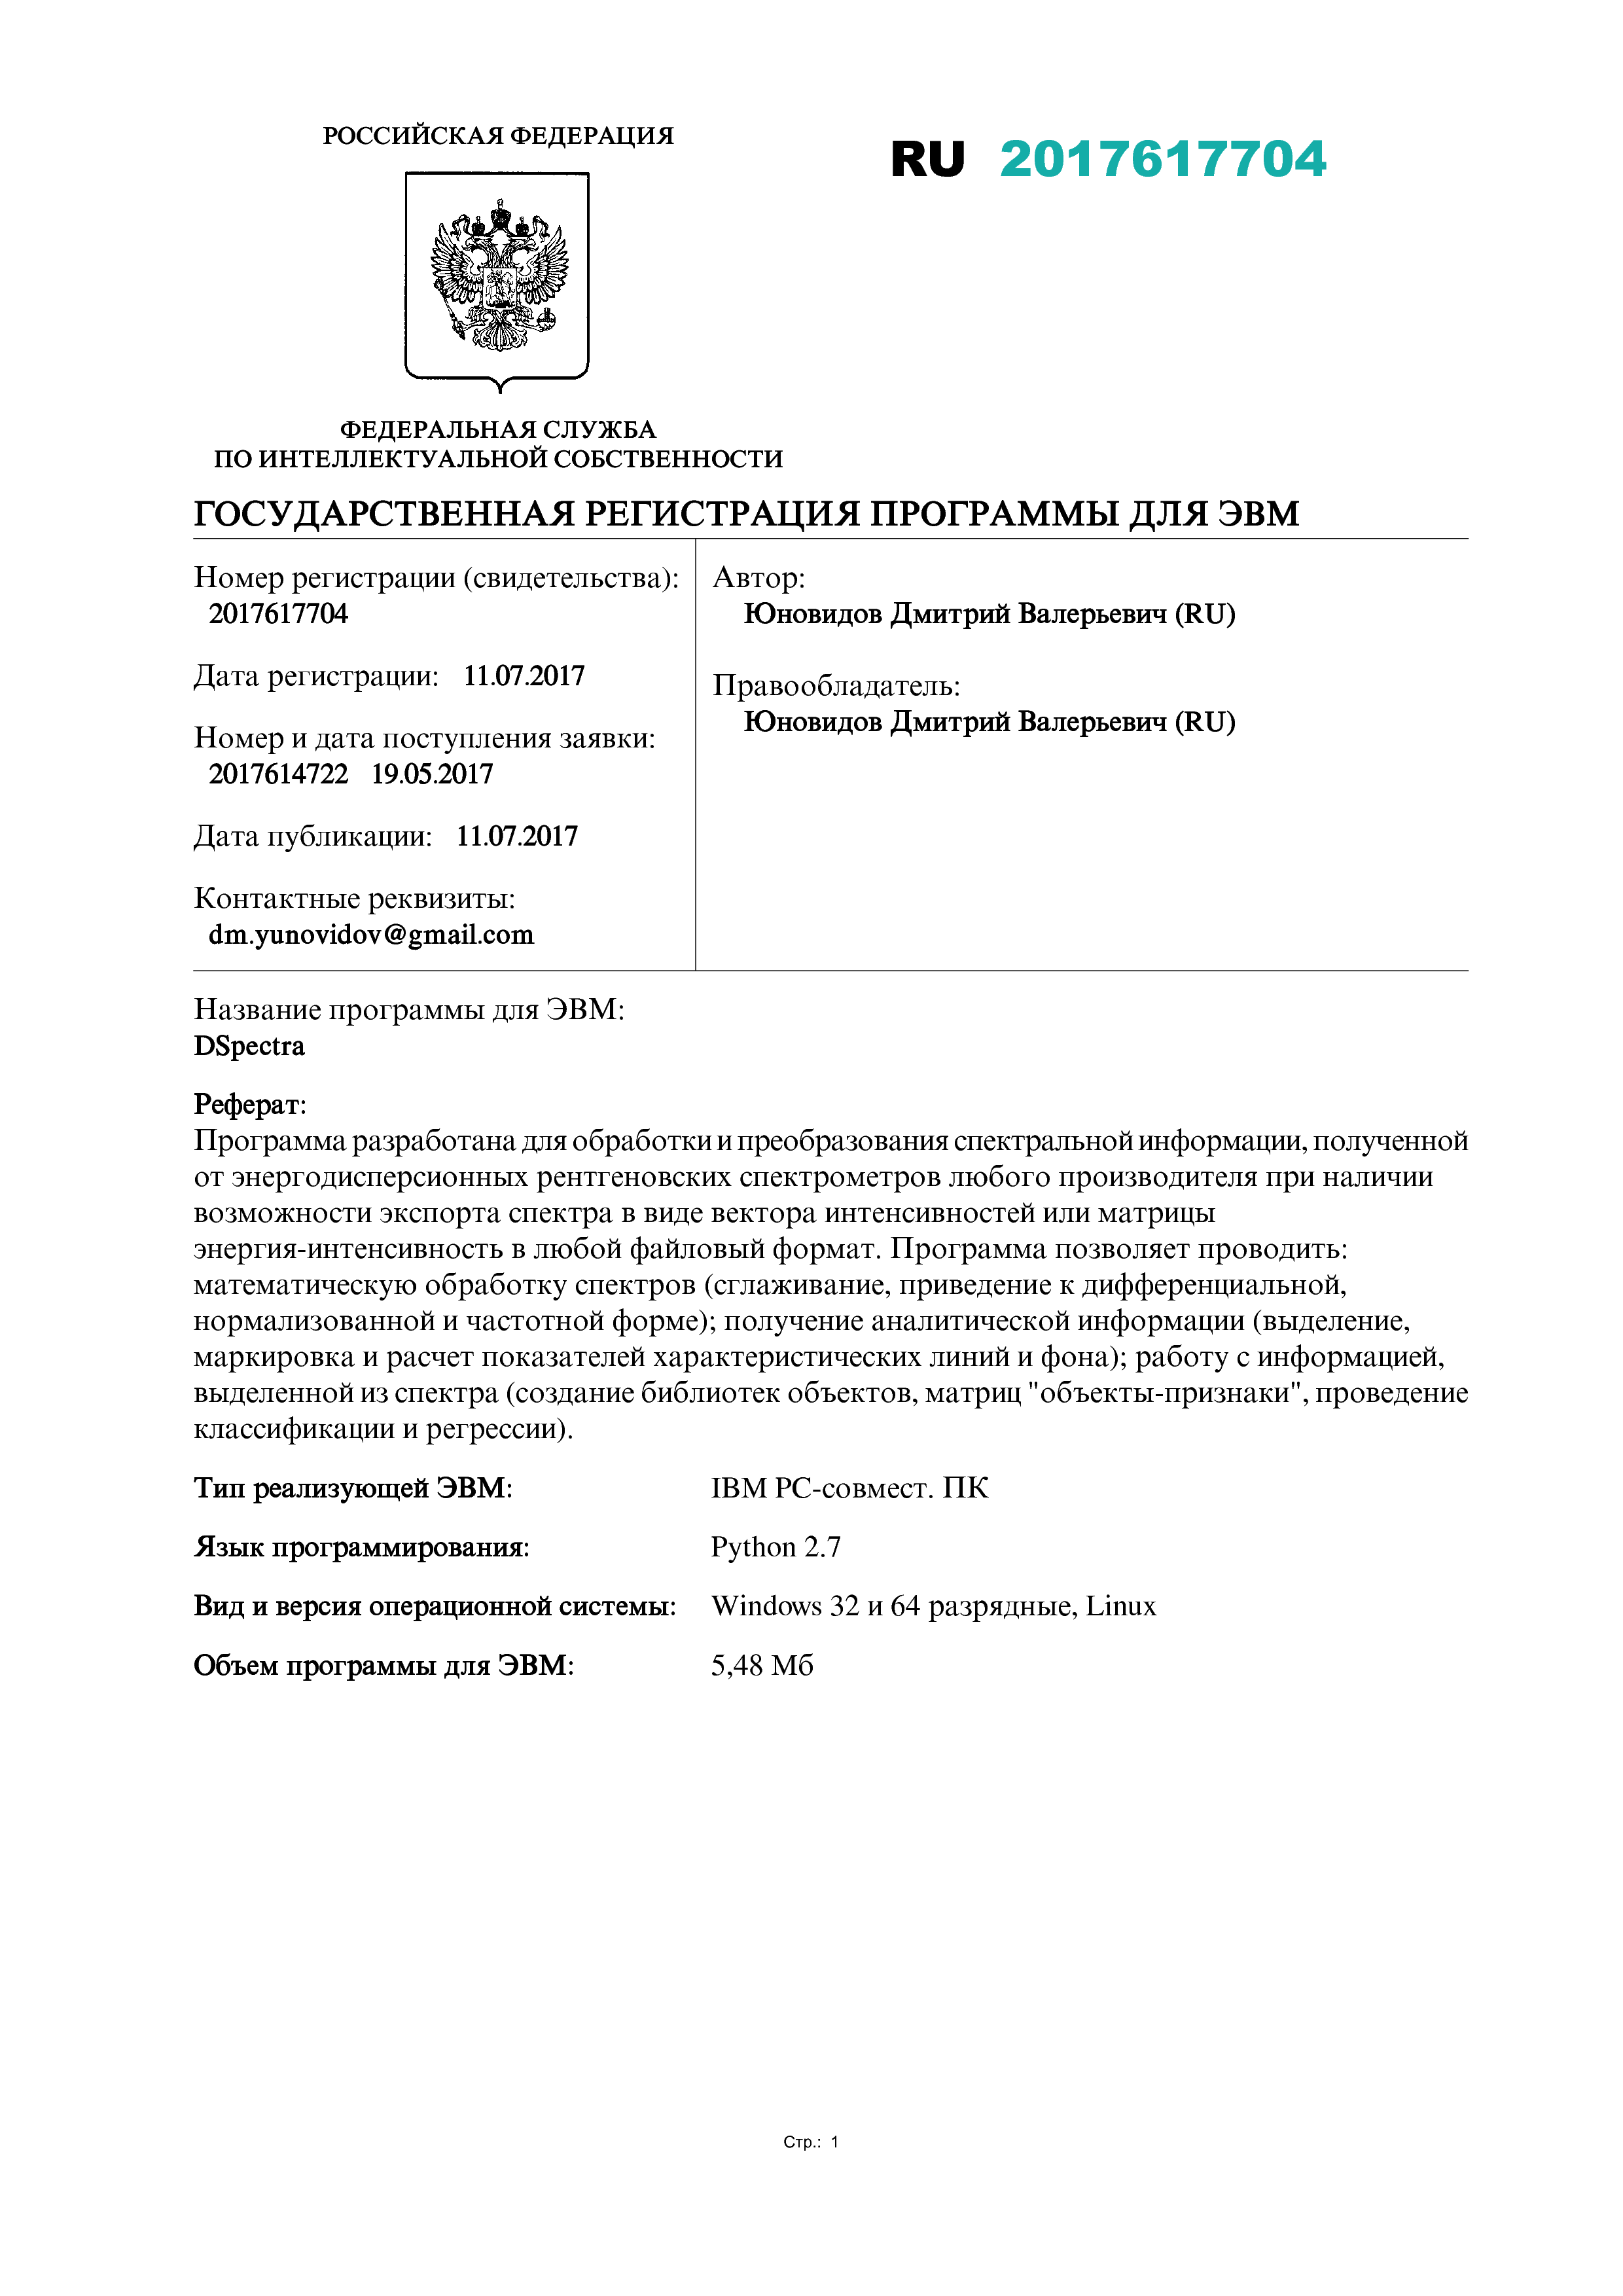
At the moment the development of the program continues, some of the algorithms are laid out on GitHab, and the basic version of the program is registered in the Federal registry of computer programs (Russian Federation).
|
|
The summary of the program.
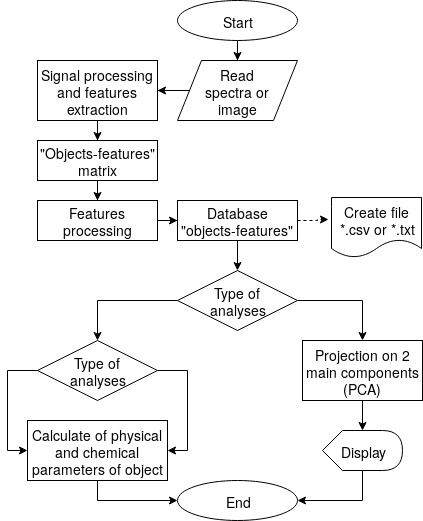
The software is designed for processing and converting spectral information obtained from energy dispersive x-ray spectrometers of any manufacturer (if it possible to export the spectrum in the form of an intensity vector or an energy-intensity matrix in any file format). Software allows you to:
- Mathematical processing of spectra:
- Smoothing according to middle and median filter algorithms, Savitsky-Golay and Fourier transforms;
- Reduction of the original spectrum to differential, normalized and frequency form.
- Obtaining analytical information:
- Manual selection and marking of characteristic lines (hereinafter - peaks);
- Calculation of intensity, area and signal-to-noise ratio for the peak;
- Calculation and leveling of the baseline;
- Automatic carrying out of all the above stages.
- Work with analytical information extracted from the spectrum:
- Creation of a library of information received;
- Construction of matrices "objects-features";
- Classification by random forest algorithms;
- Multiple regression, creating custom regression analysis methods;
- Saving custom analysis schemes.
- Possibility of line processing of spectra for each presented stage.
- Export of received information in the form of * .txt, * .csv, * .xls files.
- Construction of reports.