PhD thesis
Posted on 2018 / 06 / 28 in science
In this note the short content of my PhD work (candidate dissertation) are given (PhD of technical science; specialty 01.04.01 devises and methods of experimental physics).
|
Graphical Abstract |
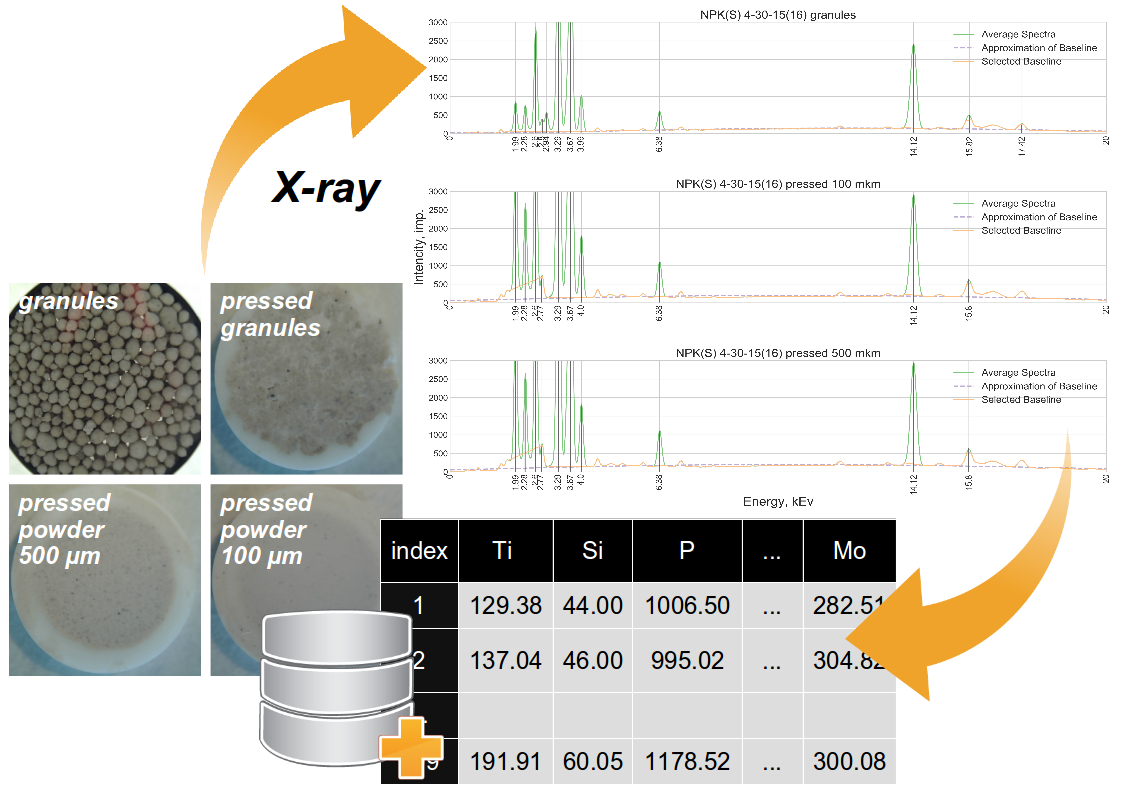
Software and hardware for combine X-ray fluorescence and optical system for analysis of complex phosphorus-containing mineral fertilizers
The presented work was carried out in the JSC "The Research Institute for Fertilizers and Insecto-fungicides named after Professor Y.V.Samoilov" (JSC "NIUIF").
| Scientific adviser: | Sokolov Valery Vasilievich, PhD of technical science, Head of Quality and Standardization Department of JSC "NIUIF" |
| Official opponents: | Eremenko Yuri Ivanovich, Doctor of Technical Sciences, Professor, Head of the Department of Automated and Information Control System of the Starooskolsky Technological Institute named after A.A.Ugarov (branch) of the federal state autonomous education institution "National Research Technological University MISiS" |
| Bagaev Kirill Alexandrovich, PhD of physical and mathematical sciences, technical director of JSC "Newcom-NDT" | |
| Lead organization | St. Petersburg State Technological Institute (Technical University), Department of Automation of Chemical Processes |
Defense of the PhD thesis took place on December 22, 2017 at 4:00 pm in the conference hall at the meeting of the dissertation council D002.034.01 at the Institute of Analytical Instrumentation at the address: 198095, St.Petersburg, Ivan Chernykh street, 31-33, lit. A. The thesis can be found in the library and on the site of the Insitute of Analytical Instrumentation.
General description of the work
The relevance of the work. Modern industrial production of mineral fertilizers is a complex and multi-factorial process in which three key objects are presented: incoming raw materials, intermediate objects (phosphoric acid, sulfuric acid, ammonia, etc.) and products. Practice shows, that without complex accounting of production parameters it is impossible to achieve reproducible and height-quality industrially produced products. For this purpose, the X-ray fluorescence analysis (XRF), which is one of the most informative methods of analytical control, is very suitable.
At the same time, this method is seldom used in the quality control of industrial produced mineral fertilizers (despite the significant development of mathematical approaches and instrumental park in last 20 years). One of the possible reasons is complexity of industrial objects. Such products have a lot of elements in base substance, which greatly increases the error of the direct XRF analysis.
However, the modern computer technology and analytical methods allows to solved these problems. They allows to accumulate and process a great amount of information in order to obtain a more detailed, accurate and reproducible research of the continuous industrial processes.
Objects of the research. The complex phosphorus-containing mineral fertilizers and their quality parameters (particles size, preliminary condition of drying, chemical composition etc.).
Purpose of the work. To create software and hardware for complex quality control device, which is based on an energy-dispersion (ED) X-ray fluorescence spectrometer and optical system. Developed device increase the efficiency, speed and reliability of quality control of industrially produced mineral fertilizers. It is necessary to solve the following tasks to achieve such goal:
- To identify meaningful chemical and physical parameters for effective X-ray and optical research of complex fertilizers matrix.
- To develop a hardware system for obtaining physical and chemical information.
- To develop an automatic algorithm for the allocation and calculation of informative features of quality of industrial produced mineral fertilizers.
- To create a prototype of a single analytical database for using big data analysis (BDA) and machine learning methods.
- To justify and develop a scheme for the complex analysis of mineral fertilizers for created device (which will minimize losses of raw materials and energy resources when facility switch from one industrially produced brand to another).
- To ensure, that the developed method can be used in industrial laboratories (provide simple and stable software and hardware).
Scientific novelty.
- The new software and hardware scheme of combine ED X-ray fluorescence spectrometer with optical surface recognition system was developed for a multi-factor express analysis of mineral fertilizers (with experimental approval).
- Techniques for determining physical and chemical parameters of mineral fertilizers were developed (concentration of various chemical elements, type, brand, fraction composition and value of conditioning additives (CA)).
- Based on the experimental results, an original analytical database of physical and chemical properties was created, which makes it possible to increase the accuracy and speed of measurements.
- The schemes of regression and classification analysis, which is based on fertilizers brand (nutrients (N, P, K) and sulfur) and physical properties was developed.
- On the basis of ED XRF and the compiled database, the technique for determining nitrogen in mineral fertilizers was proposed (direct detection of which by the ED XRF method is impossible).
- The developed software for the device, which provides automatic calculation and big data analysis for mineral fertilizers was created and registered.
- A technique for determining the fraction of pressed samples for ED XRF with an optical surface recognition was developed.
Practical significance.
The developed techniques and device are used in the "PosAgro" corporation mineral fertilizers facilities. The developed algorithms for data processing are used in the some ED XRF spectrometers, which is produced by JSC "Scientific Instruments".
- To implement presented techniques, a software and hardware complex was developed which allowed to increase the sensitivity, accuracy and speed of mineral fertilizers quality control.
- A new prototype of devise with ED XRF and optical recognition was created and tested for analysis of the chemical composition (all nutrients and sulfur) and particle size of objects. The proposed equipment have broad prospective both in the laboratory and in the industrial automated control.
- An original techniques for control of granules size and conditioning quality were implemented.
- A scheme of the multi-factors control was developed for minimize losses of raw materials and energy resources when industrial production switch from one fertilizers brand to another.
Main theses.
- Software and hardware for device, which is based on the ED XRF spectrometer and optical system (for surface recognition and multi-factor express analysis of mineral fertilizers).
- Algorithms for features preparations for database of physical and chemical properties of industrial produced mineral fertilizers (concentration of various chemical elements, type, brand, fraction composition and presence of CA).
- The original mathematical model of the rapid and complex analysis of the investigating objects, which is used for determine:
- physical properties (brand, maximum size of particles, preliminary condition of drying and presence of conditioning additive);
- chemical properties (concentration of nutrient and sulfur, type and brand, including concentration of nitrogen, which is not determined directly by the ED XRF).
- Algorithms and software ("DSpectra"), which provide automated calculation of analytical signals, features for big data analysis, regression and correlation models.
In accordance with the passport of specialization (01.04.01 - "Devices and methods of experimental physics") the presented work describe the development of technique for significantly increasing the accuracy, sensitivity and speed of measurements of physical properties. It is used for quality control of industrially produced mineral fertilizers. Moreover, the automated physical experiment was implemented. A small sized and efficient device for obtaining complex physical and chemical information was developed as well.
Publication. Eight article were published, including two in the journals, which are recommended by the Higher Attestation Commission of the Russian Federation. Four reports at Russian and international conferences and seminars and one certificate of software registration were published as well. A list of works is given at the end of this note.
The structure and volume of the work. Current research (in Russ.) is presented at 187 pages and consist of an introduction, six chapters, conclusion, appendix and list of references with 116 titles. The work contains 50 tables and 65 figures.
The summary of the work
Introduction (the first chapter) is devoted to the dissertation aim. The aim, tasks and relevance are formulated. The scientific novelty, practical significance and main theses are determined.
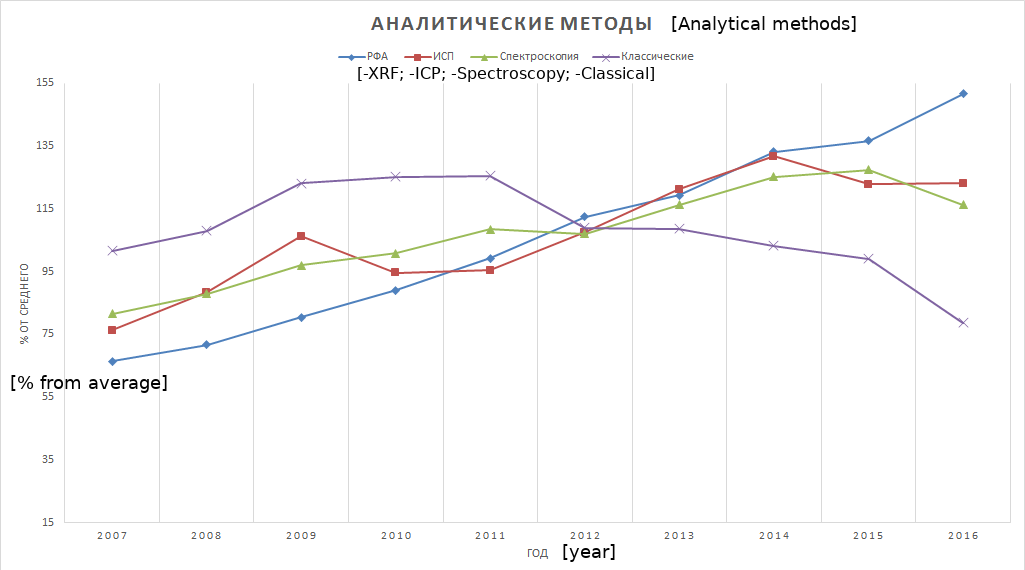
The second chapter gives an overview of Russian and foreign literature, which is related to the topic of the work. The characteristics of modern industrial production of complex phosphorus-containing mineral fertilizers were given. The main products, which determine the quality of all technology were highlighted (ore (apatite), extraction phosphoric acid (EPhA) and various types and brands of fertilizers). The type of fertilizer represent the macro- and micro-components composition (MAF - mono-ammonium phosphate (NP), NPK, NPK(S), NP(S+S)+Zn, which contains the elemental sulfur and zinc as additions). In the other hand, the mark of fertilizers represents the quantitative content of components, which is mentioned in type (12-52, 15-15-15, 4-30-15 (16), 12-40(6+3)+1 respectively). The brand represents both type and mark of fertilizers. Furthermore, the main object of the research was described (the phosphorus-containing mineral fertilizers). The physical and chemical parameters of the fertilizers base were examined and the quality markers were identified. The various techniques for process and obtain of analytical information were investigated. Moreover, the different methods of analytical control in industrial and environmental practice were reviewed, and their properties and applicability were estimated. It was established, that the XRF-analysis is the most informative and express methods of quality control (Figure 1). As the result, the software and hardware properties of express and informative analysis for industrially produced mineral fertilizers were identified. The tasks were set.
|
| Fig. 1. Number of articles devoted to one or another analytical method, normalized to the average number of articles per year. The figure consists of articles, which were published over the past 10 years (based on the Scopus search results). The "XRF" is the combination of energy disperse and wave technique; "ICP" - various types of spectroscopy with inductively coupled plasma; "Spectroscopy" - methods of spectroscopy without ICP; "classical" - titration and gravimetry. |
The third chapter is devoted to the theoretical basis of multi-factor control of fertilizers. Methods of classification, regression and clusterization were examined. Mathematical and statistical approaches to accumulation and processing of objects features are considered. All mathematical algorithms for this work are presented. Necessity of noise reduction is established (for achieve the completeness and quality of analysis of industrially produced objects). Various algorithms of the data transformations was carried out for such purpose:
- normalization, balancing and coding of data;
- smoothing and calculation of anomalies in images from the optical system;
- smoothing the XRF spectrum with different filters (middle and median filters, Savitsky-Golay, Fourier transform with cutting of noise frequencies);
- use of various automated algorithms for identifying and calculating the intensities of characteristic lines (differentiation and "zero filter").
Furthermore, the required features for building a database "objects-features" for statistical analysis are given (Table 1).
Table 1. Main features of objects and its types.
| Features | Type of values |
|---|---|
| intensity of chemical elements in the spectrum | numeric |
| maximum size of particles (fraction) | categorical* |
| preliminary condition of drying | binary |
| number of artifacts in "surface map" | numeric |
| area of artifacts in "surface map" | numeric |
| fertilizer type | categorical* |
| fertilizer mark | numeric |
* features, which belong to certain category and can't be compare to each other (also known as nominal)
To identify the missing binary and categorical data various classification models were describe (logistic regression, regression with regularization, random forest and naive Bayes). Moreover, classification was used to monitor the proximity of products quality to required ones. Such information are especially relevant when facility switch production from one fertilizer brand to another. Accurate and reproducible classification allows resources and energy saving in such processes.
Variants regression algorithms were considered after the classification (for determining the chemical properties of fertilizers). Regression coefficients use different regularization type:
-
L1 (Ridge): \(w=argmin_w(\frac{1}{l}\sum_{i=1}^l (\langle w, x_i \rangle − y_i)^2 + \lambda \sum_{i=1}^d w_j^2)\);
-
L2 (Lasso): \(w=argmin_w(\frac{1}{l}\sum_{i=1}^l (\langle w, x_i \rangle − y_i)^2 + \lambda \sum_{i=1}^d |w_j|\);
while the coefficients without regularization are:
- \(w=argmin_w(\frac{1}{l}\sum_{i=1}^l (\langle w, x_i \rangle − y_i)^2)\).
where \(w\) is the coefficient in front of the feature, \(x_i\) - the i feature, \(\langle w, x_i \rangle\) - the scalar product of the vector (coefficients and features), \(y_i\) - the response, \(l\) - parameters quantity, \(d\) and \(\lambda\) - optimization parameters.
Finally, the several techniques for big data analysis were justified for further using as a result of this chapter. They quality metrics are describe (precision, recall and F-metrics for classification and standard deviation (STD), Pearson's coefficient of correlation and Spearman's coefficient of correlation for regression). The "grid search" method for optimal parameters detection was described for each of the presented algorithms. In addition, various techniques for data dimension reduce and visualize were presented.
The schemes of experiments are describe in the fourth chapter. The list of developed device and equipment include diagrams and detailed instructions. The other list is the used resources (instruments, reagents and working samples).
The scheme of a multi-factorial experiment for controlling the fertilizers quality when production switch from NP(S) 12-40(10) to the NP(S+S)+Zn 12-40(6+3)+1 is given. The main procedures of sample preparation for classification and regression analysis are described. Table of used samples are compiled (7 types of objects, about 170 samples in 3 parallel measurements). The algorithm for optimal parameters determination for X-ray device with optical system is describe.
The general sample preparation procedure includes select of a representative sample from the mass of the product and it preparation for analysis. The crumbled (with various particle size) samples are pressed into pellets with 20 mm diameters as a "sandwich structure" on a boric acid substrate. Next, with developed hardware and software the general algorithm for measuring properties of mineral fertilizer was proposed.
The main chapter result is the total experimental plan for collect and analyze data.
The fifth chapter include tuning the developed device and its working algorithm (XRF and optical analysis). Moreover, the chapter describe creation of single database of studied samples. The optical procedure of samples' physical parameters estimation is performed (including conditioning additives, which are the most expensive raw material for mineral fertilizers). It's working parameters were tuned up and selected.
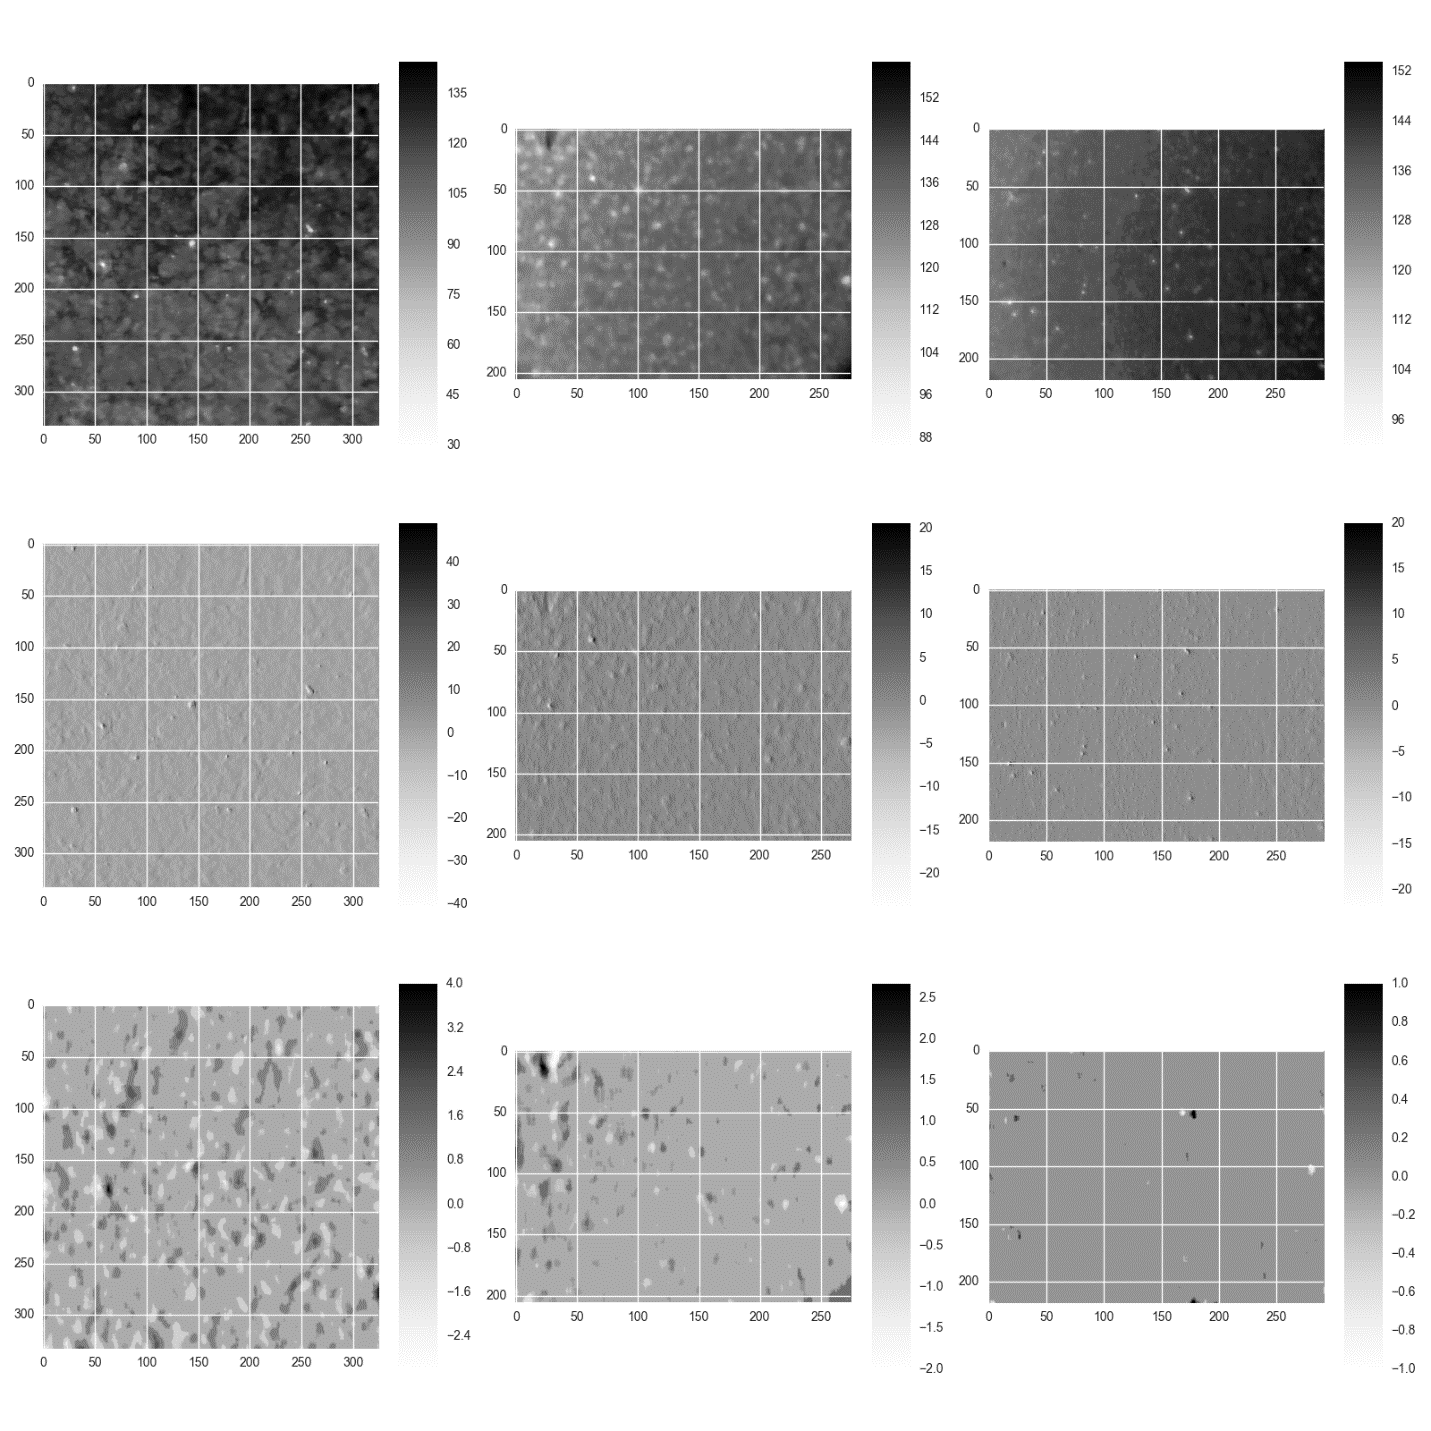
A photograph of the sample's surface (in normal and UV light) was used to obtain the optical features. The resolution of photo is at least 640 × 480 pixels. Next, surface area with at least 100 × 100 pixels was allocated from photo. Finally, from the selected area the "surface map" was constructed (Figure 2). The "surface map" is the intensity (brightness) of each pixel in range [0; 250], which calculated as follow:
where \(I_R\), \(I_G\), \(I_B\) are the intensity of red, green and blue pixels respectively.
|
||
|---|---|---|
| (a) | (b) | (c) |
| Fig. 2. An example of the photo processing. The width and length of the image are number of pixels. (a) - pressed granules, (b) - pressed powder with grains < 500 μm, (c) - pressed powder with grains < 100 μm. The first row is an unprocessed "surface map", the second row is a differentiated image, the third row is a differentiated and smoothed image that forms a final "surface map". | ||
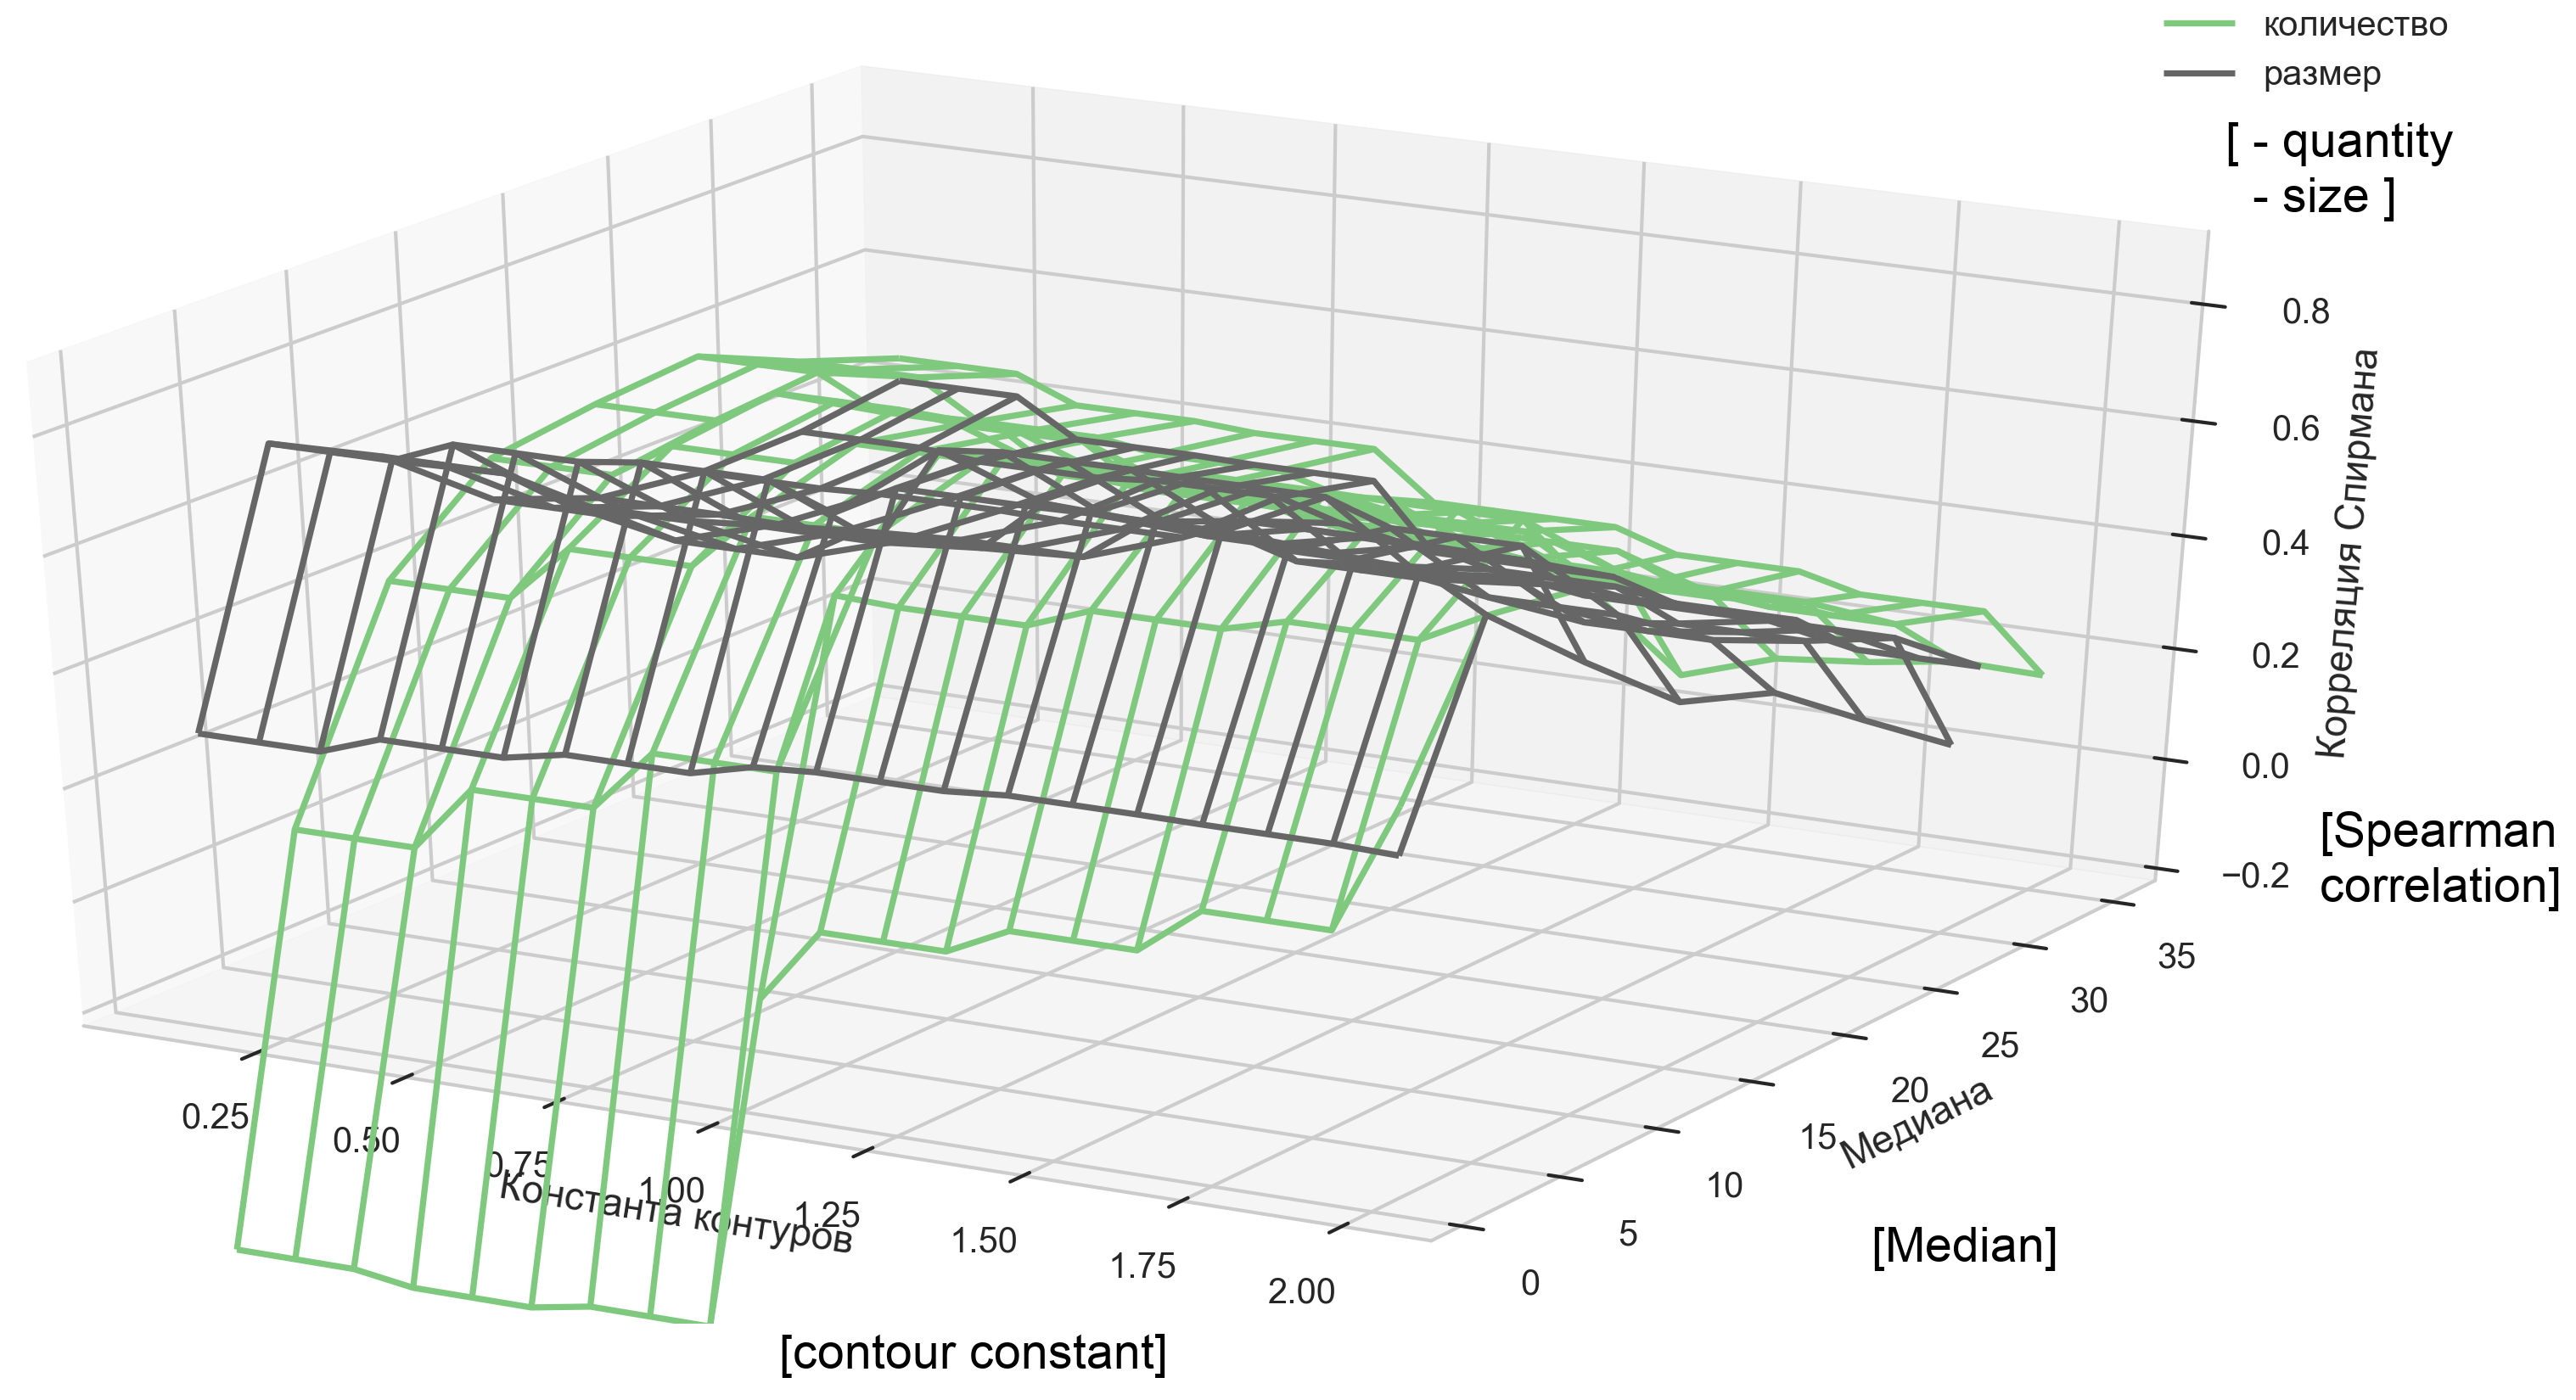
The area of total "artifacts" pixels (which is difference from 0) is calculated from the smoothed "surface map". It has been established, that this parameter is in good agreement with containing CA (as binary feature, in case of UV illumination) and type of particle size (as categorical feature for granules, 500 μm and 100 μm powders, in case of visible light illumination). Moreover, the classification algorithm parameters were carried out (Figure 3). Thus, the optimal parameters of classification were distinguished (median filter window is 10 pixels and constant of contour search is 0.5), which were based on the "surface map".
|
| Fig. 3. Surface of correlation coefficient values (between find artifacts on "surface map" and size of pressed grains as numeric features 100, 500 and 5000 μm). On XYZ axes are smoothing window, contour constant value and Spearman correlation coefficient (the strength of the monotonic relationship) respectively. |
Furthermore, the tuning of XRF analysis parameters was carried out. Main aims are reduce the noise level and automate features selection for spectra. For each type of mineral fertilizer several quality metrics were estimated under various operating conditions (smoothing force, STD of signals in the spectrum, the magnitude of the characteristic lines shift and the number of automatically detected lines). As the result, the following stages of algorithm are justified (Figure 4).
- Smooth with Savitsky-Golya filter (fast and did not change the shape and position of characteristic lines) with 10 units window width and 4th degree of equation.
- Automatic search of characteristic lines and selection of the background component by the "zero filter" algorithm with a window width (v) of 10 units and a width of the shift (w) of 10 units, which is the most flexible and accurate.
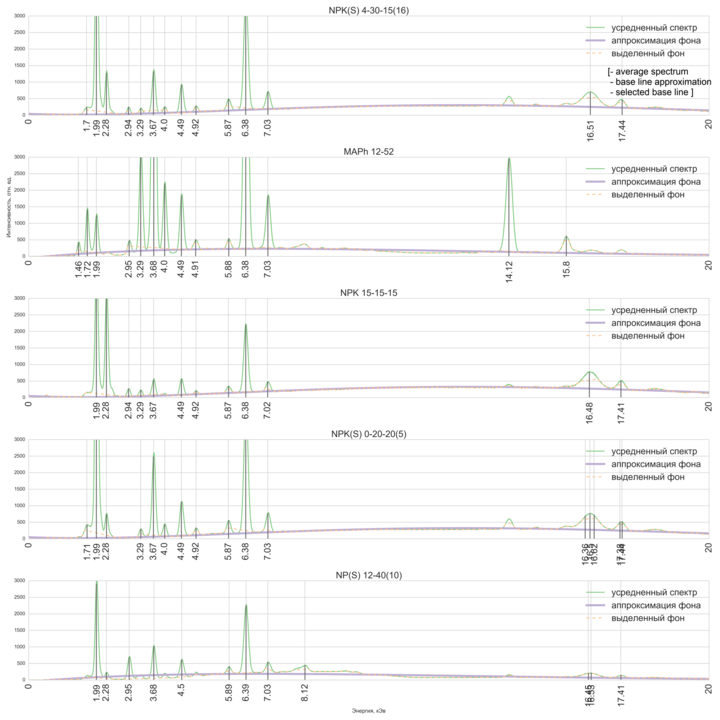
|
| Fig. 4. Example of the proposed algorithm's results. |
On the basis of found optimal parameters the clear and significant information for the developed X-ray and optical combined devise was identified. Preprocess of selected features were carried out (balancing, normalization and coding). The single database "objects-features" was compiled as the result.
The sixth chapter is devoted to work with the obtained database and to transform selected features into useful analytical information. The various machine learning models of classification, regression and clusterization was studied to calculate the parameters of mineral fertilizers quality (based on quality metrics, which was selected in chapter 3).
Five classification algorithms were examined (regression, regression with regularization (L1 and L2), random forest and naive Bayes). The described algorithms are used to determine not numeric features (the brand of sample, the type of particles size and the pre-drying condition). Fist, the quality of the proposed algorithms were compared for each part of the developed devise separate (optical and ED XRF). Next, the use of combined device was justified. The F-metric (harmonic mean of precision and recall) characteristic for described machine learning classifications algorithms is shown on Table 2. The Random Forest algorithm is the best.
Table 2. F-metric (%) quality of work of classifiers.
| Classifier | N mark | P mark | K mark | S mark | Fraction | Pre-drying condition |
| Regression | 99.31 | 99.78 | 99.59 | 99.56 | 92.40 | 72.94 |
| Regression with L1 regularization | 99.65 | 99.78 | 99.57 | 98.87 | 92.51 | 73.08 |
| Regression with L2 regularization | 99.65 | 99.78 | 100.0 | 98.99 | 91.33 | 68.46 |
| Random Forest | 100.0 | 100.0 | 100.0 | 98.99 | 98.40 | 73.37 |
| Naive Bayes | 71.12 | 60.71 | 66.84 | 73.72 | 53.32 | 73.04 |
Similarly, optimal parameters for the regression algorithms were searched as well (for determining the chemical composition of the fertilizers). The STD and coefficient of determination were chosen as quality metrics (Table 3).
All the missing physical parameters (categorical) in the original matrix were filled with selected classification approach. Further, the regression model was constructed to calculate the concentration of the main nutrient elements in fertilizers. As the result, the possibility of indirect determination of the nitrogen content were shown.
Table 3. \(R^2\) (%) quality of regression algorithms
| N % | P % | K % | S % | |
| Range of concentration, mas. % | [0; 16] |
[15; 52] |
[0; 20] |
[0; 20] |
| Linear regression | 98.78 | 98.00 | 99.61 | 98.17 |
| Linear regression with L1 regularization | 97.04 | 97.10 | 99.26 | 95.79 |
| Linear regression with L2 regularization | 98.78 | 97.70 | 99.61 | 98.17 |
Thus, the proposed classification and regression algorithms works with sufficient accuracy (more than 98% for the selected quality metrics in general). They provide a quick estimate of the quality of industrially produced mineral fertilizers and work in automate mode.
A procedure for clustering data for their visual representation was also performed. Algorithms for linear and nonlinear reduction of the dimensions are used to construct a "type map". It is two-dimensional representation of the whole fertilizers properties. It is shown, that the use of a linear principal component analysis (PCA) gives the best results (Figure 5).
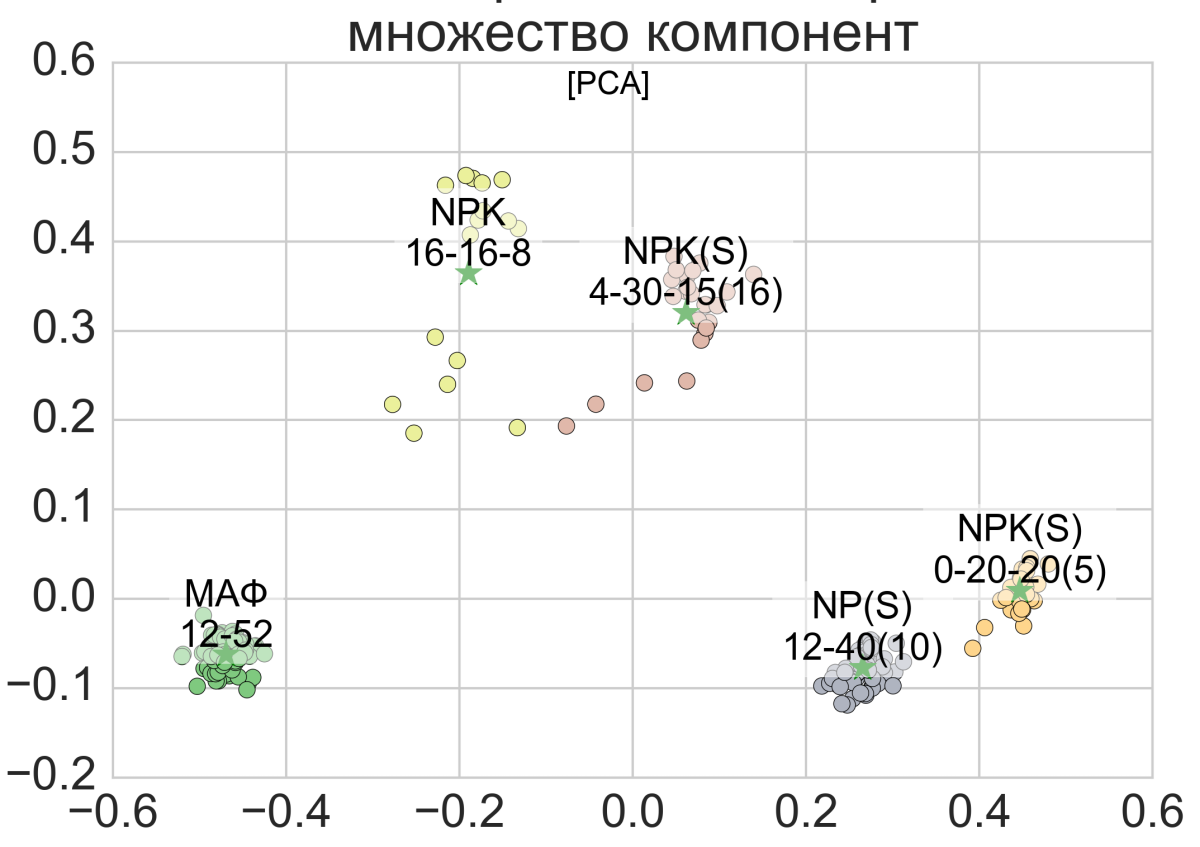
|
| Fig. 5. Two components projection analysis (PCA) of fertilizers properties. Green stars indicates centers of clusters (calculated by the k-means algorithm). |
Methods for calculating the necessary analytical information with database "objects-features" and machine learning techniques are the results of sixth chapter. The Random Forest is the best algorithm for classification (according to F-measure). Linear regression with L2 regularization is the best algorithm for determine numerical properties. And the linear PCA with 2 components is sufficient for represent the whole researched properties of fertilizers. In addition, a scheme for calculating the distance between classes of objects in PCA is proposed for fast determine they similarity.
The seventh chapter describes the software algorithm of the developed device as well as shows various industrial tests (inside "PhosAgro" corporation facilities). It is consider several approaches:
- calculate physical and chemical properties of mineral fertilizers;
- optimizing sample preparation conditions;
- control products, when production switch to new types or brands of fertilizers;
- calculate some additional quality parameters for fertilizers (granulometric composition and sphericity).
The structure of the software, based on previously chosen algorithms (Chapter 6) is shown in Figure 6. An additional feature of the software is the ability to monitor the quality of the lab technician's work. Monitoring is performed on the basis of the maximum allowed fraction (calculated with Chapter 6 classification algorithm).
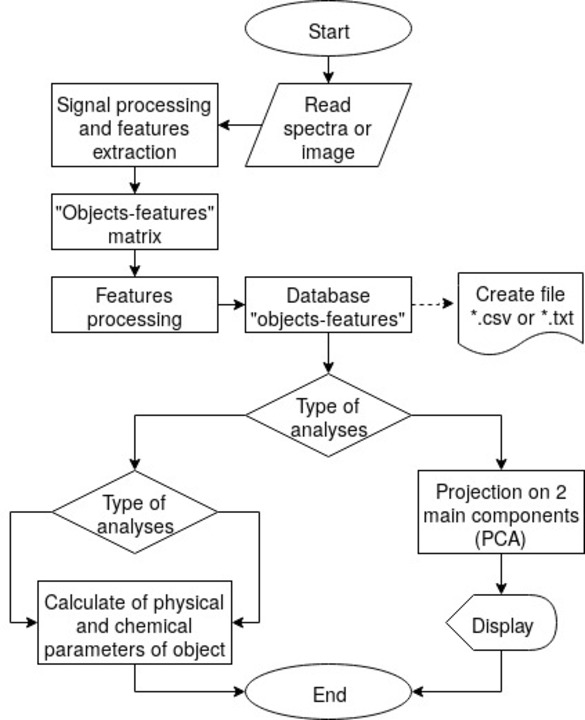
|
| Fig. 6. Structure of "DSpectra" software |
With the developed software and classification approach some of the optimizing sample preparation tasks is solved. In other hand, statistical parameters were evaluated for different stage of samples preparation for possibility of its elimination (Table 4).
Table 4. Stages of sample preparation, which optimization is needed.
| Type of sample preparation | Crushing to < 500 μm | Crushing to < 100 μm | Is dryed | Spend time * |
| 1** | - | - | - | - |
| 2 | + | - | - | 15 |
| 3 | + | + | - | 40 |
| 4 | + | - | + | 30 |
| 5 | + | + | + | 45 |
* approximate preparation time for 20 g product
** pressed granules of fertilizer
It was established, that preliminary drying of objects as well as their crushing to 100 microns insignificantly affect to the result of the XRF-optical combined devise (because of to multi-factorial algorithms). To ensure, we studied differences in characteristic lines of most inhomogeneous fertilizer NPK(S) 4-30-15(16).
According to obtained results, there are some differences in standard deviation between dried and not dried objects, which is not affect the average value and statistically insignificant. According to t-test we can eliminate this stage of sample preparation.
On the other hand, there is an abnormal decrease in variability for the 500 μm fraction, compare to 100 μm fraction. Such result indicate improvement in the quality of XRF analysis for the 500 μm fraction (abnormal effect)! We explain this effect by instability of some fertilizers powders in air condition. Such instability is greater for 100 μm tablets (faster moisturing and surface swelling). Based on the obtained data the fast sample preparation procedure is proposed (grinding up to 500 μm without preliminary drying). This method allow to reduce the analysis time from 45 to 10 minutes and preserve accuracy of used machine learning algorithms.
Next step is results of an industrial tests to monitor the quality of product for production switch from fertilizer NP(S) 12-40(10) to NP(S+S)+Zn 12-40(6+3)+1 (with elemental sulfur, Balakovo facility of JSC "Apatite"). The transition process took three days, sampling was carried out every 60 minutes. The developed combined device gave out information in 10 minutes after sampling (the classical chemical analysis of N, P and \(SO_4\) + S took about 4 hours). To visualize the process we use automatic clustering into two main components (Figure 8).
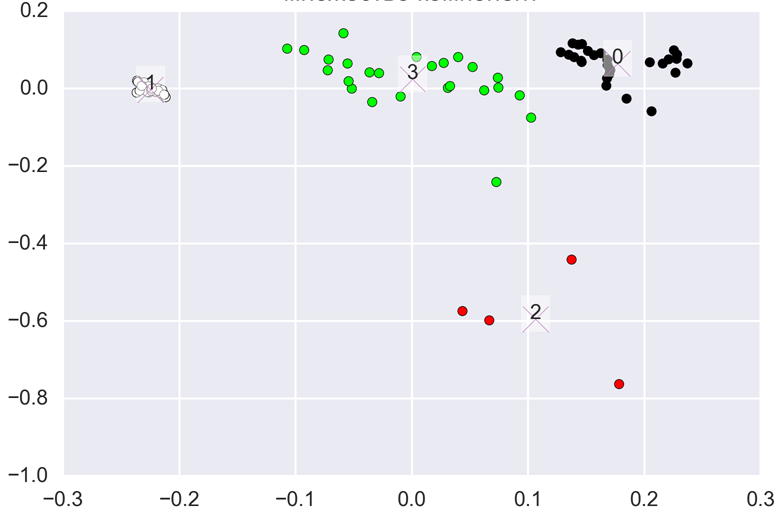
|
| Fig. 8. An automatic PCA of transition process for developed combined device. 0 - final product, 1 - initial product, 2 - significant emissions, problems in technology, 3 - the transition process. |
Finally, some "non-trivial" quality analysis with developed device are described. Various brands of mineral fertilizers were studied for particle size, form factor, degree of treatment with CA and conductivity of dilute solutions (salt index).
We shown, that developed combined devise can use each of type of analysis in separate ways. The optical block can determine granules size, shape and color. The accuracy of particle size calculation was compare with the most common alternative methods (Table 5). The proposed device well agree with the "woven" sieves (sieve with square cells, European standards). But each of methods is deviate from each other.
Table 5. Data comparison for different particle size determination methods (for MAP (NP) 12-52, Balakovo facilities of JSC "Apatite").
| Fraction, mm | Camsizer, % | Sieve with round cell, % | Sieve with square cells, % | Developed, % | delta "Camsizer-Developed", % | delta "Round cells-Developed", % | delta "Square cells-Developed", % |
| 0-1 | 0.00 | 0.02 | 0.03 | 0.00 | 0.00 | 0.02 | 0.03 |
| 1-2 | 0.27 | 0.09 | 0.16 | 0.00 | 0.27 | 0.09 | 0.16 |
| 2-3 | 20.57 | 11.05 | 40.29 | 27.35 | 6.78 | 16.30 | 12.94 |
| 3-4 | 75.13 | 81.14 | 56.12 | 56.50 | 18.63 | 24.64 | 0.38 |
| 4-5 | 3.93 | 7.52 | 3.35 | 15.31 | 11.38 | 7.79 | 11.96 |
| \>5 | 0.10 | 0.19 | 0.05 | 0.84 | 0.74 | 0.65 | 0.79 |
In addition, we can build the "quality maps" of the granulated industrially produced fertilizers with developed technique (characterize the fertilizers by its particles size and particles shape). Examples of such maps are shown in Figure 9. Industrially produced MAP (NP 12-52) is better then NPK 9-25-25 (more spherical for each granules size).
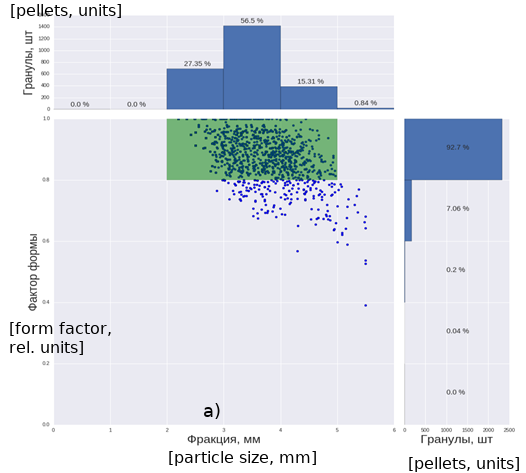
|
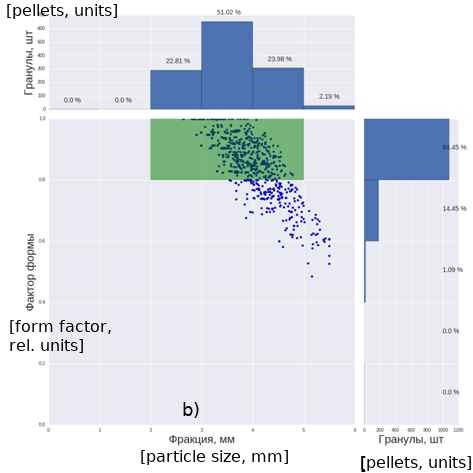
|
| Fig. 9. "Quality maps" of granulated industrially produced fertilizers (particles sphericity VS size), a) - MAP (NP 12-52), which produced by the Balakovo facilitie of JSC "Apatit" (Balacovo city, Russia), b) - NPK 9-25-25, which produced by the JSC "Apatit" (Cherepovets city, Russia). The green area is theoretical area of quality products. |
Next part is calculation of amount of conditioning additive on the granules (with using UV light for optical part of combined device, Figure 10). The amount of CA (which is directly proportional to fluorescing area) depends not only of the quantity of the CA, but also of type of fertilizer and method of applying the CA. Using this fact and numeric representation of area of fluorescing contours on image, we can improve laboratory control of industrial process of conditioning of fertilizers.
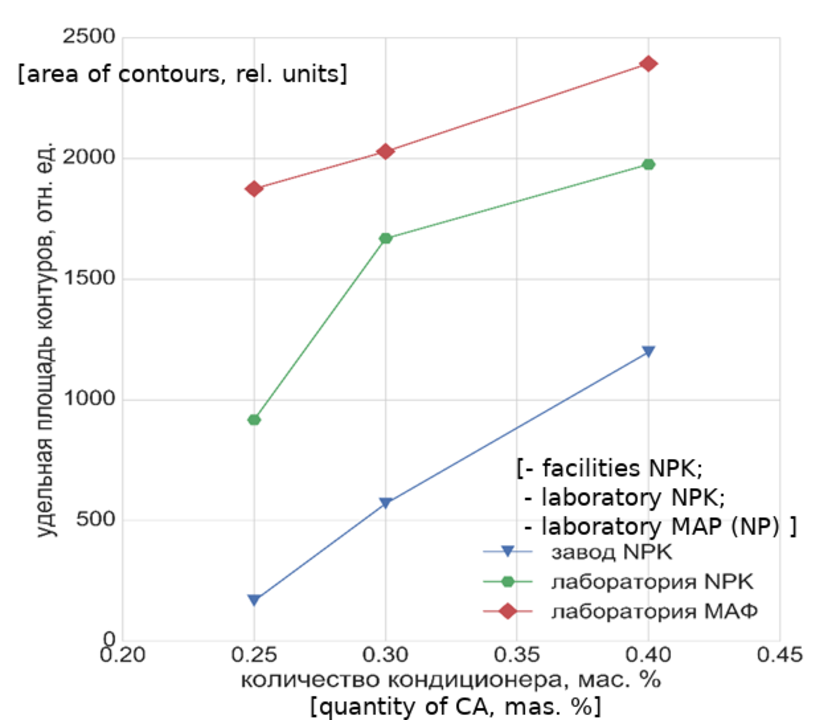
|
Fig. 10. The specific area of fluorescing area (contours) on the surface map VS the amount of CA. |
The "Salt Index" is another parameter of mineral fertilizers quality (sometimes it is approximated as the value of the conductivity of 0.1% fertilizer solution in distill water). Salt index depends of the chemical composition of fertilizers. We propose XRF method to determine it (base on the spectral lines of elements with multiple-factors regression, Figure 11). The correlation coefficient between the spectra features and the conductivity of dilute solutions is 95.9\%.
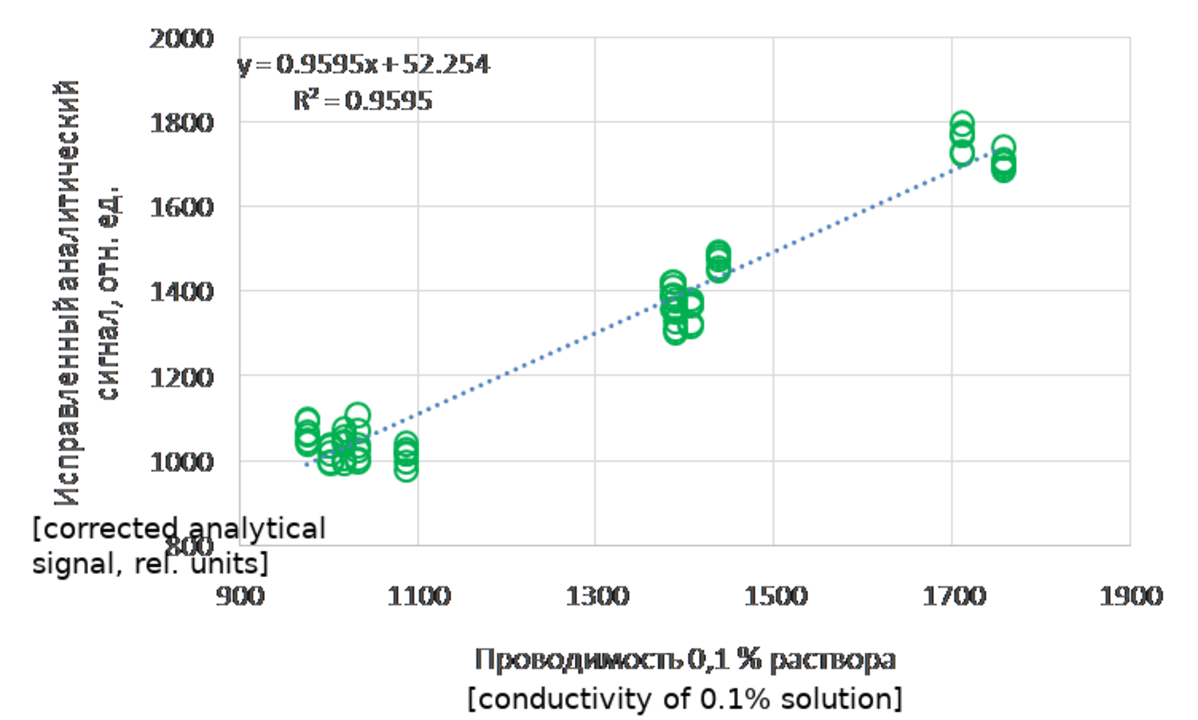
|
| Fig. 11. Regression line conductivity of dilute solutions of mineral fertilizers VS XRF features. |
Results of the work are presented in scientific literature: [1] (analysis of complex phosphorus-containing fertilizers), [2] (analysis of apatite concentrate with machine learning algorithms), [3] (software registration certificate), [4] - [9] (construction of regression models and a mathematical features for XRF spectra).
Results and conclusions
The main results are listed below.
-
Significant chemical and physical parameters for the complex matrix of mineral fertilizers are highlighted (anomalies on the surface map (optical recorder), intensity of lines of chemical elements, background area and intensity of coherent and incoherent scattering of X-ray fluorescent analysis).
-
Possibility of nitrogen content determination in complex phosphorus-containing fertilizers by indirect features was proved.
-
An express and low cost device for combine analysis mineral fertilizers was developed (optical system and XRF analysis). Sample preparation for it was optimized.
-
The automatic algorithm of selection and calculation of informative features at quality control of industrially production was developed.
-
The prototype of unified database of "object-features" of mineral fertilizer for machine learning algorithms was created.
-
The possibility of solving a wider range of tasks with the use of the developed software and hardware device was proved (compare to classical XRF).
-
Possibility of calculation of other significant features of mineral fertilizers quality was shown ("quality maps", presence of pre-drying, salt index, etc.).
-
The software, which provides convenient and simple implementation of all developed algorithms was created and applied in production practice.
Publications
- Yunovidov D.V., Sokolov V.V., Bakhvalov A.S. The Use of the Sample Spectrum for Assessing the Impact of Different Stages of the NPKS Fertilizer Preparation on the Results of X-Ray Fluorescence Analysis // Industrial laboratory. Diagnostics of materials, 83 (9), 15-21 (2017). (In Russ.)
- Yunovidov D.V., Sokolov V.V., Bakhvalova E.V, Donskikh V.A. Development of a standard sample of apatite concentrate. Effective control of homogeneity by XRF analysis methods, GIAB, 7, 131-144 (2016). (In Russ.)
-
Certificate No. 2017617704 Russian Federation. Program "DSpectra" / Yunovidov D.V.; applicant and rights holder Yunovidov D.V. - No 2017614722; declared 19.05.2017; registered in the Register of computer programs 11.07.2017 - [1] p.
Other articles and conference materials.
-
Yunovidov D.V., Sokolov V.V., Oskolok K.V., Bolotokov A.A. X-ray fluorescent determination of cerium in extraction phosphoric acid and phosphate concentrates // World of sulfur, N, P and K. 2012. No 4. p. 10-13. (In Russ.)
-
Yunovidov D.V., Sokolov V.V., Oskolok K.V., Bolotokov A.A. X-ray fluorescence determination of rare earth elements after sorption extraction and concentration from extraction phosphoric acid // Phosphate raw materials: production and processing. 2013. p. 147-151. (In Russ.)
-
Yunovidov D.V., El-Salim S.Z., Oskolok K.V. Restoration of homogeneous system spectrum according to time dependencies of line intensities in nascent and developing heterogeneous system on the example of extraction phosphoric acid // VIII All-Russian Conference on X-ray Spectroscopy. Irkutsk, September 22 - 26, 2014 Abstracts of the reports. - Irkutsk. Institute of the Earth's Crust, SB RAS, 2014. p. 139-139. (In Russ.)
-
Yunovidov D.V., El-Salim S.Z., Oskolok K.V. Virtual experiment technique and its application for quantitative X-ray fluorescence analysis of phosphoric acid extraction. // VIII All-Russian Conference on X-ray Spectroscopy. Irkutsk, September 22 - 26, 2014 Abstracts of the reports. - Irkutsk. Institute of the Earth's Crust, SB RAS, 2014. p. 140-140. (In Russ.)
-
Yunovidov D.V., Rebrikova A.T., Oskolok K.V., Sokolov V.V. X-ray fluorescence determination of technologically important elements in extraction phosphoric acid // The Second Congress of Russian Analysts. Moscow, September 23 - 27, 2013 Abstracts of the reports. Moscow. p. 289-289. (In Russ.)
-
Yunovidov D.V., Rebrikova A.T., Oskolok K.V., Sokolov V.V. The technique of a virtual experiment for quantitative X-ray fluorescence analysis of extracted phosphoric acid // The Second Congress of Russian Analysts. Moscow, 23 - 27 September 2013 Abstracts. Moscow. p. 290-290. (In Russ.)
-
Yunovidov D., Sokolov V., Bahvalov A. Big data analysis and comprehensive analytical control of fertilizers, 11 Winter School of Chemometrics (WSC 11). St. Petersburg, Russia, 2018. Thesis (In Russ.).
Further development of this work you can see on this site. The show is still go on!